NASA Inaugurates New Space Station Era as Earth Science Observation Platform with RapidScat Instrument:

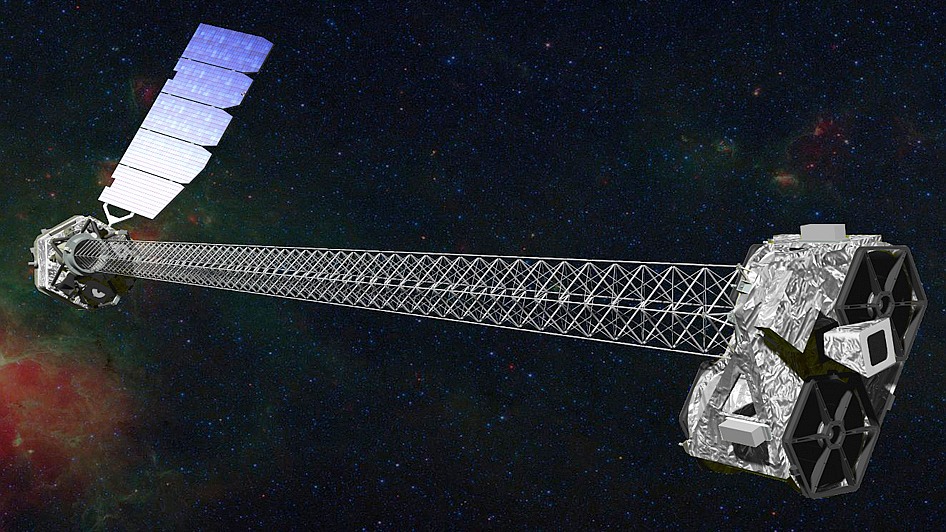
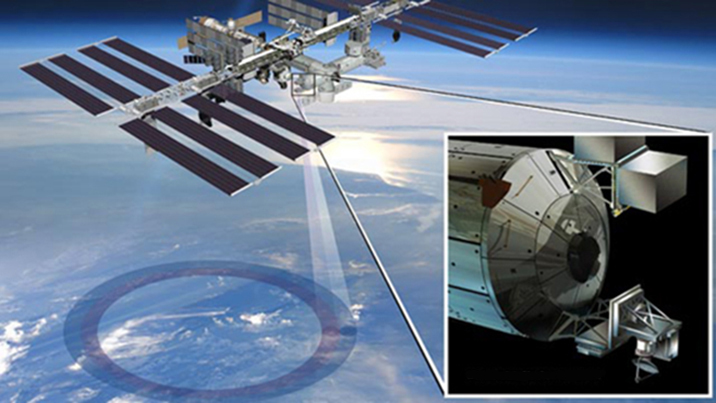
ISS-RapidScat instrument, shown in this artist’s rendering, was launched to the International Space Station aboard the SpaceX CRS-4 mission on Sept. 21, 2014. It will measure ocean surface wind speed and direction and help improve weather forecasts, including hurricane monitoring. Credit: NASA/JPL-Caltech/Johnson Space Center.
NASA inaugurated a new era of research for the
International Space Station (ISS) as an
Earth observation platform following the successful installation and activation of the ISS-RapidScat science instrument on the outposts exterior.
The ISS Rapid Scatterometer, or
ISS-RapidScat, is NASA’s first research payload aimed at conducting near global Earth science from the stations exterior and will be augmented with others in coming years.
RapidScat is designed to monitor ocean winds for climate research, weather predictions and hurricane monitoring.
The 1280 pound (580kilogram) experimental instrument is already collecting its first science data following its recent power-on and activation at the station.
“Its antenna began spinning and it started transmitting and receiving its first winds data on Oct.1,” according to a NASA statement.
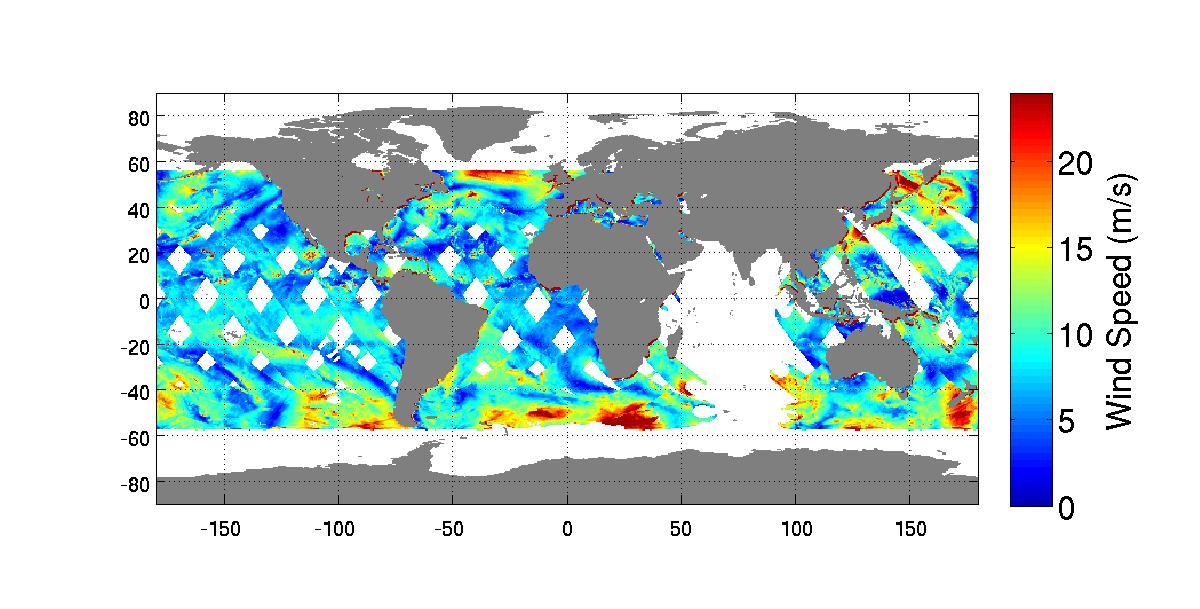
The first image from RapidScat was released by NASA on Oct. 6, shown below, and depicts preliminary measurements of global ocean near-surface wind speeds and directions.

Launched Sept. 21, 2014, to the International Space Station, NASA’s newest Earth-observing mission, the International Space Station-RapidScat scatterometer to measure global ocean near-surface wind speeds and directions, has returned its first preliminary images. Credit: NASA-JPL/Caltech
The remote sensing instrument uses radar pulses to observe the speed and direction of winds over the ocean for the improvement of weather forecasting.
“Most satellite missions require weeks or even months to produce data of the quality that we seem to be getting from the first few days of RapidScat,” said RapidScat Project Scientist Ernesto Rodriguez of NASA’s Jet Propulsion Laboratory, Pasadena, California, which built and manages the mission.
“We have been very lucky that within the first days of operations we have already been able to observe a developing tropical cyclone.
“The quality of these data reflect the level of testing and preparation that the team has put in prior to launch,” Rodriguez said in a NASA statement. “It also reflects the quality of the spare QuikScat hardware from which RapidScat was partially assembled.”
RapidScat, payload was hauled up to the station as part of the science cargo
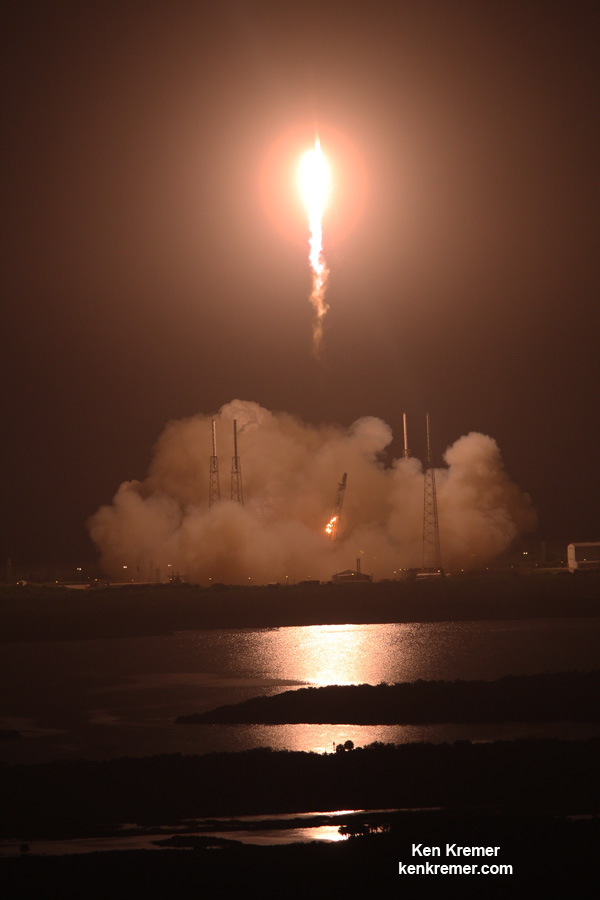
launched aboard the commercial SpaceX Dragon CRS-4 cargo resupply mission that thundered to space on the company’s
Falcon 9 rocket from Space Launch Complex-40 at Cape Canaveral Air Force Station in Florida on Sept. 21.
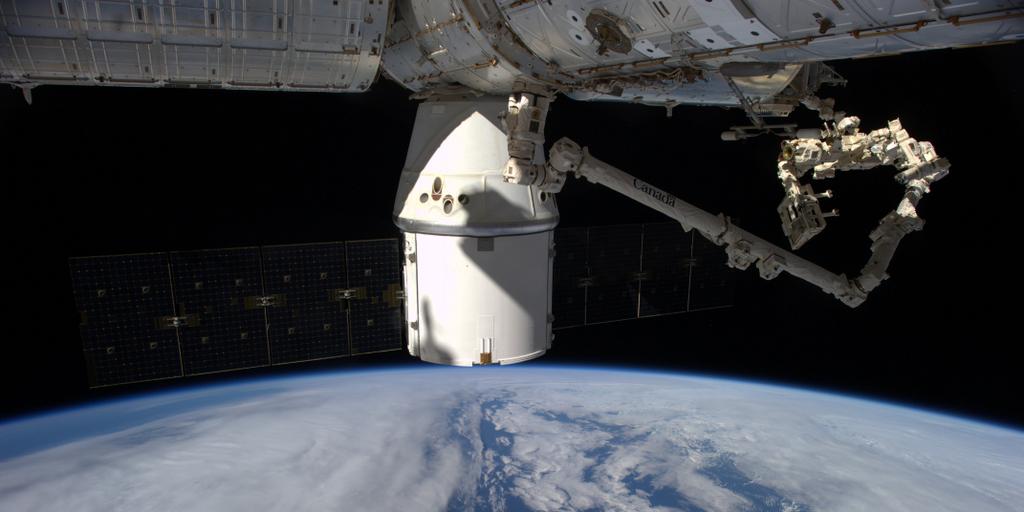
Dragon was successfully berthed at the Earth-facing port on the stations Harmony module on Sept 23, as detailed –
here.
It was robotically assembled and attached to the exterior of the station’s Columbus module using the station’s robotic arm and DEXTRE manipulator over a two day period on Sept 29 and 30.
Ground controllers at Johnson Space Center intricately maneuvered DEXTRE to pluck RapidScat and its nadir adapter from the unpressurized truck section of the Dragon cargo ship and attached it to a vacant external mounting platform on the Columbus module holding mechanical and electrical connections.

Fascinating: #Canadarm & Dextre installed the #RapidScat Experiment on Columbus! @ISS_Research @NASAJPL @csa_asc. Credit: ESA/NASA/Alexander Gerst
The nadir adapter orients the instrument to point at Earth.
The couch sized instrument and adapter together measure about 49 x 46 x 83 inches (124 x 117 x 211 centimeters).
Engineers are in the midst of a two week check out process that is proceeding normally so far. Another two weeks of calibration work will follow.
Thereafter RapidScat will begin a mission expected to last at least two years, said Steve Volz, associate director for flight programs in the Earth Science Division, NASA Headquarters, Washington, at a prelaunch media briefing at the Kennedy Space Center.
RapidScat is the forerunner of at least five more Earth science observing instruments that will be added to the station by the end of the decade.
The second Earth science instrument, dubbed CATS, could be added by year’s end.
The Cloud-Aerosol Transport System (CATS) is a laser instrument that will measure clouds and the location and distribution of pollution, dust, smoke, and other particulates in the atmosphere.
CATS is slated to launch on the next SpaceX resupply mission, CRS-5, currently targeted to launch from Cape Canaveral, Fl on Dec. 9.

A SpaceX Falcon 9 rocket carrying a Dragon cargo capsule packed with science experiments and station supplies blasts off from Space Launch Complex 40 at Cape Canaveral Air Force Station, Florida, at 1:52 a.m. EDT on Sept. 21, 2014 bound for the ISS. Credit: Ken Kremer/kenkremer.com
This has been a banner year for NASA’s Earth science missions. At least five missions will be launched to space within a 12 month period, the most new Earth-observing mission launches in one year in more than a decade.
ISS-RapidScat is the third of five NASA Earth science missions scheduled to launch over a year.
NASA has already launched the
Global Precipitation Measurement (
GPM) Core Observatory, a joint mission with the Japan Aerospace Exploration Agency in February and the Orbiting Carbon Observatory-2
(OCO-2) carbon observatory in July 2014.

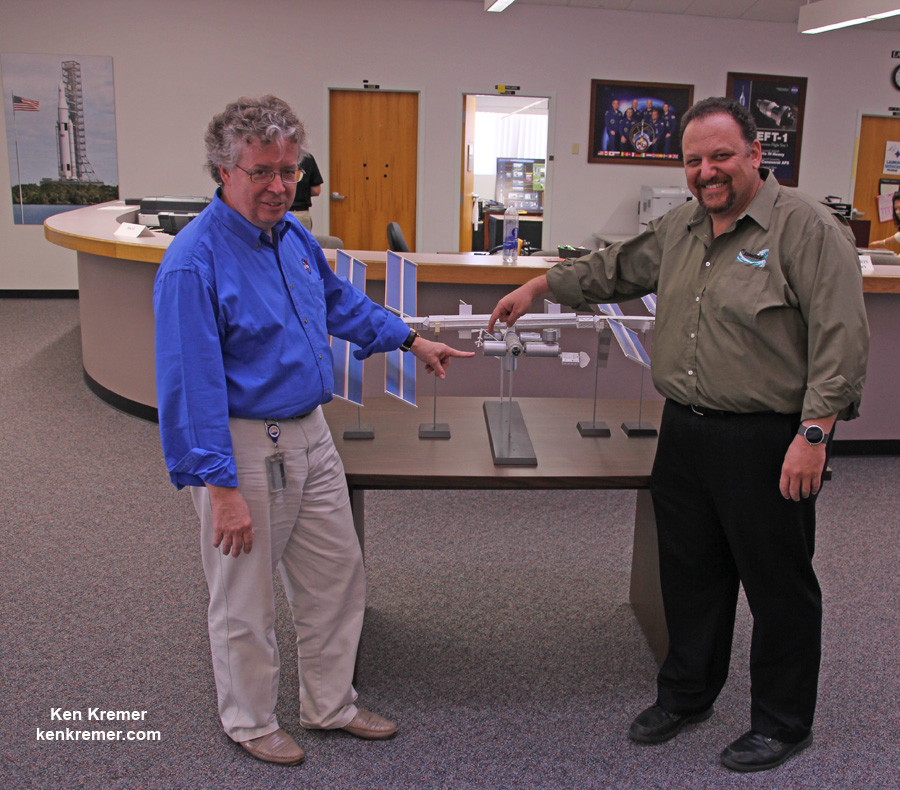
NASA managers show installed location of ISS-RapidScat instrument on the Columbus module on an ISS scale model at the Kennedy Space Center press site during launch period for the SpaceX CRS-4 Dragon cargo mission. Posing are Steve Volz, associate director for flight programs in the Earth Science Division, NASA Headquarters, Washington and RapidScat Project Scientist Ernesto Rodriguez of NASA’s Jet Propulsion Laboratory, Pasadena, California. Credit: Ken Kremer – kenkremer.com
Stay tuned here for
Ken’s continuing Earth and Planetary science and human spaceflight news.
Ken Kremer
…………….
Learn more about Commercial Space Taxis, Orion and NASA Human and Robotic Spaceflight at
Ken’s upcoming presentations:
Oct 14: “What’s the Future of America’s Human Spaceflight Program with Orion and Commercial Astronaut Taxis” & “Antares/Cygnus ISS Rocket Launches from Virginia”; Princeton University,
Amateur Astronomers Assoc of Princeton (AAAP), Princeton, NJ, 7:30 PM
Oct 23/24: “Antares/Cygnus ISS Rocket Launch from Virginia”; Rodeway Inn, Chincoteague, VA

Dr. Ken Kremer is a speaker, scientist, freelance science journalist (Princeton, NJ) and photographer whose articles, space exploration images and Mars mosaics have appeared in magazines, books, websites and calanders including Astronomy Picture of the Day, NBC, BBC, SPACE.com, Spaceflight Now and the covers of Aviation Week & Space Technology, Spaceflight and the Explorers Club magazines. Ken has presented at numerous educational institutions, civic & religious organizations, museums and astronomy clubs. Ken has reported first hand from the Kennedy Space Center, Cape Canaveral and NASA Wallops on over 40 launches including 8 shuttle launches. He lectures on both Human and Robotic spaceflight - www.kenkremer.com. Follow Ken on Facebook and Twitter
Tagged as:
commercial resupply services (CRS),
Commercial Space,
CRS,
CRS-4,
CRS-5,
Dragon,
Dragon capsule,
Earth,
Earth Observation,
Earth science,
Falcon 9,
hurricane monitoring,
International Space Station (ISS),
ISS,
ISS-Rapidscat,
NASA,
NASA Earth science,
ocean winds,
RapidScat,
SpaceX,
weather forecasting


![An illustration [click for video] of a rotation neutron star, the remnants of a super nova explosion has been found to be an ultraluminous X-ray source, the first of its kind. (Credit: NASA, Caltech-JPL)](https://lh3.googleusercontent.com/blogger_img_proxy/AEn0k_s0fxZzivVj0ihsfPNRsLkow0JEUv4iel4ODj5ADP6r62Be20czvmbpP56A6OZOK24qlzGdmDzDTUrRPsYk6OxzvOSJPW2UYfqnQZOvUctwPHelDwCvobQh4jUlxDy1OQQ8k56XMyPJbfwlbtHukSjH-XYuSuxrQQqQ9cLnmweoZ7lpMVMMUCOv0xsy3Du5WZTiTsOgon0l3ayymBddbGOAp6vhQK0=s0-d)


 Artist's concept of CubeSats near Jupiter's moon Europa. Image Credit: NASA/JPL
 This map shows anomalous U.S. methane emissions (or how much the emissions differ from average background concentrations) for 2003 to 2009, as measured by the European Space Agency's SCIAMACHY instrument. Purple and dark blue areas are below average. Pale blue and green areas are close to normal or slightly elevated. Yellows and red indicate higher-than-normal anomalies, with more intense colors showing higher concentrations. The Four Corners area - the area where Arizona, Colorado, New Mexico and Utah meet -- is the only red spot on the map.Image credit: NASA/JPL-Caltech/University of Michigan