Tuesday, August 15, 2017

IC 10: A Starburst Galaxy with the Prospect of Gravitational Waves

IC 10: A Starburst Galaxy with the Prospect of Gravitational Waves:


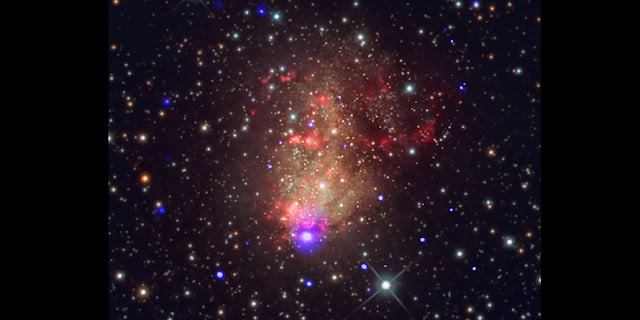
This new composite image of IC 10 combines X-ray data from Chandra (blue) with an optical image (red, green, blue) taken by amateur astronomer Bill Snyder from the Heavens Mirror Observatory in Sierra Nevada, California. The X-ray sources detected by Chandra appear as a darker blue than the stars detected in optical light. Credit: X-ray: NASA/CXC/UMass Lowell/S.Laycock et al. Optical: Bill Snyder Astrophotography


In 1887, American astronomer Lewis Swift discovered a glowing cloud, or nebula, that turned out to be a small galaxy about 2.2 billion light years from Earth. Today, it is known as the "starburst" galaxy IC 10, referring to the intense star formation activity occurring there.

More than a hundred years after Swift's discovery, astronomers are studying IC 10 with the most powerful telescopes of the 21st century. New observations with NASA's Chandra X-ray Observatory reveal many pairs of stars that may one day become sources of perhaps the most exciting cosmic phenomenon observed in recent years: gravitational waves.

By analyzing Chandra observations of IC 10 spanning a decade, astronomers found over a dozen black holes and neutron stars feeding off gas from young, massive stellar companions. Such double star systems are known as "X-ray binaries" because they emit large amounts of X-ray light. As a massive star orbits around its compact companion, either a black hole or neutron star, material can be pulled away from the giant star to form a disk of material around the compact object. Frictional forces heat the infalling material to millions of degrees, producing a bright X-ray source.

When the massive companion star runs out of fuel, it will undergo a catastrophic collapse that will produce a supernova explosion, and leave behind a black hole or neutron star. The end result is two compact objects: either a pair of black holes, a pair of neutron stars, or a black hole and neutron star. If the separation between the compact objects becomes small enough as time passes, they will produce gravitational waves. Over time, the size of their orbit will shrink until they merge. LIGO has found three examples of black hole pairs merging in this way in the past two years.

Starburst galaxies like IC 10 are excellent places to search for X-ray binaries because they are churning out stars rapidly. Many of these newly born stars will be pairs of young and massive stars. The most massive of the pair will evolve more quickly and leave behind a black hole or a neutron star partnered with the remaining massive star. If the separation of the stars is small enough, an X-ray binary system will be produced.

This new composite image of IC 10 combines X-ray data from Chandra (blue) with an optical image (red, green, blue) taken by amateur astronomer Bill Snyder from the Heavens Mirror Observatory in Sierra Nevada, California. The X-ray sources detected by Chandra appear as a darker blue than the stars detected in optical light.

The young stars in IC 10 appear to be just the right age to give a maximum amount of interaction between the massive stars and their compact companions, producing the most X-ray sources. If the systems were younger, then the massive stars would not have had time to go supernova and produce a neutron star or black hole, or the orbit of the massive star and the compact object would not have had time to shrink enough for mass transfer to begin. If the star system were much older, then both compact objects would probably have already formed. In this case transfer of matter between the compact objects is unlikely, preventing the formation of an X-ray emitting disk.

Chandra detected 110 X-ray sources in IC 10. Of these, over forty are also seen in optical light and 16 of these contain "blue supergiants", which are the type of young, massive, hot stars described earlier. Most of the other sources are X-ray binaries containing less massive stars. Several of the objects show strong variability in their X-ray output, indicative of violent interactions between the compact stars and their companions.

A pair of papers describing these results were published in the February 10th, 2017 issue of The Astrophysical Journal and is available online here and here. The authors of the study are Silas Laycock from the UMass Lowell's Center for Space Science and Technology (UML); Rigel Capallo, a graduate student at UML; Dimitris Christodoulou from UML; Benjamin Williams from the University of Washington in Seattle; Breanna Binder from the California State Polytechnic University in Pomona; and, Andrea Prestwich from the Harvard-Smithsonian Center for Astrophysics in Cambridge, Mass.

NASA's Marshall Space Flight Center in Huntsville, Alabama, manages the Chandra program for NASA's Science Mission Directorate in Washington. The Smithsonian Astrophysical Observatory in Cambridge, Massachusetts, controls Chandra's science and flight operations.

Galactic Winds Push Researchers to Probe Galaxies at Unprecedented Scale

Galactic Winds Push Researchers to Probe Galaxies at Unprecedented Scale:


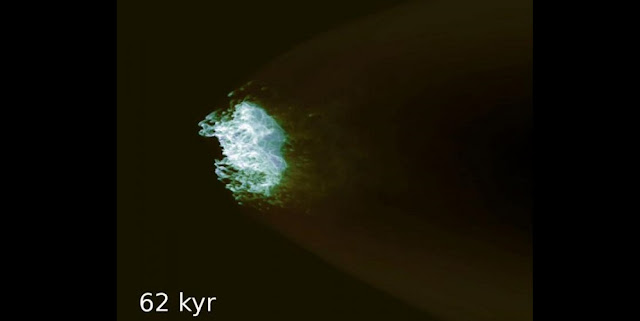
Rather than getting pushed, the simulation shows the cold material instead becomes gradually heated until it is fully incorporated into the hot wind. Credit: Evan Schneider, Princeton University


When astronomers peer into the universe, what they see often exceeds the limits of human understanding. Such is the case with low-mass galaxies—galaxies a fraction of the size of our own Milky Way. These small, faint systems made up of millions or billions of stars, dust, and gas constitute the most common type of galaxy observed in the universe. But according to astrophysicists’ most advanced models, low-mass galaxies should contain many more stars than they appear to contain.

A leading theory for this discrepancy hinges on the fountain-like outflows of gas observed exiting some galaxies. These outflows are driven by the life and death of stars, specifically stellar winds and supernova explosions, which collectively give rise to a phenomenon known as “galactic wind.” As star activity expels gas into intergalactic space, galaxies lose precious raw material to make new stars. The physics and forces at play during this process, however, remain something of a mystery.

To better understand how galactic wind affects star formation in galaxies, a two-person team led by the University of California, Santa Cruz, turned to high-performance computing at the Oak Ridge Leadership Computing Facility (OLCF), a US Department of Energy (DOE) Office of Science User Facility located at DOE’s Oak Ridge National Laboratory (ORNL). Specifically, UC Santa Cruz astrophysicist Brant Robertson and University of Arizona graduate student Evan Schneider (now a Hubble Fellow at Princeton University), scaled up their Cholla hydrodynamics code on the OLCF’s Cray XK7 Titan supercomputer to create highly detailed simulations of galactic wind.

“The process of generating galactic winds is something that requires exquisite resolution over a large volume to understand—much better resolution than other cosmological simulations that model populations of galaxies,” Robertson said. “This is something you really need a machine like Titan to do.”

After earning an allocation on Titan through DOE’s INCITE program, Robertson and Schneider started small, simulating a hot, supernova-driven wind colliding with a cool cloud of gas across 300 light years of space. (A light year equals the distance light travels in 1 year.) The results allowed the team to rule out a potential mechanism for galactic wind.

Now the team is setting its sights higher, aiming to generate nearly a trillion-cell simulation of an entire galaxy, which would be the largest simulation of a galaxy ever. Beyond breaking records, Robertson and Schneider are striving to uncover new details about galactic wind and the forces that regulate galaxies, insights that could improve our understanding of low-mass galaxies, dark matter, and the evolution of the universe.

About 12 million light years from Earth resides one of the Milky Way’s closest neighbors, a disk galaxy called Messier 82 (M82). Smaller than the Milky Way, M82’s cigar shape underscores a volatile personality. The galaxy produces new stars about five times faster than our own galaxy’s rate of star production. This star-making frenzy gives rise to galactic wind that pushes out more gas than the system keeps in, leading astronomers to estimate that M82 will run out of fuel in just 8 million years.

Analyzing images from NASA’s Hubble Space Telescope, scientists can observe this slow-developing exodus of gas and dust. Data gathered from such observations can help Robertson and Schneider gauge if they are on the right track when simulating galactic wind.

“With galaxies like M82, you see a lot of cold material at large radius that’s flowing out very fast. We wanted to see, if you took a realistic cloud of cold gas and hit it with a hot, fast-flowing, supernova-driven outflow, if you could accelerate that cold material to velocities like what are observed,” Robertson said.

Answering this question in high resolution required an efficient code that could solve the problem based on well-known physics, such as the motion of liquids. Robertson and Schneider developed Cholla to carry out hydrodynamics calculations entirely on GPUs, highly parallelized accelerators that excel at simple number crunching, thus achieving high-resolution results.

In Titan, a 27-petaflop system containing more than 18,000 GPUs, Cholla found its match. After testing the code on a GPU cluster at the University of Arizona, Robertson and Schneider benchmarked Cholla under two small OLCF Director’s Discretionary awards before letting the code loose under INCITE. In test runs, the code has maintained scaling across more than 16,000 GPUs.

“We can use all of Titan,” Robertson said, “which is kind of amazing because the vast majority of the power of that system is in GPUs.”

The pairing of code and computer gave Robertson and Schneider the tools needed to produce high-fidelity simulations of gas clouds measuring more than 15 light years in diameter. Furthermore, the team can zoom in on parts of the simulation to study phases and properties of galactic wind in isolation. This capability helped the team to rule out a theory that posited cold clouds close to the galaxy’s center could be pushed out by fast-moving, hot wind from supernovas.

“The answer is it isn’t possible,” Robertson said. “The hot wind actually shreds the clouds and the clouds become sheared and very narrow. They’re like little ribbons that are very difficult to push on.”

Having proven Cholla’s computing chops, Robertson and Schneider are now planning a full-galaxy simulation about 10 to 20 times larger than their previous effort. Expanding the size of the simulation will allow the team to test an alternate theory for the emergence of galactic wind in disk galaxies like M82. The theory suggests that clouds of cold gas condense out of the hot outflow as they expand and cool.

“That’s something that’s been posited in analytical models but not tested in simulation,” Robertson said. “You have to model the whole galaxy to capture this process because the dynamics of the outflows are such that you need a global simulation of the disk.”

The full-galaxy simulation will likely be composed of hundreds of billions of cells representing more than 30,000 light years of space. To cover this expanse, the team must sacrifice resolution. It can rely on its detailed gas cloud simulations, however, to bridge scales and inform unresolved physics within the larger simulation.

“That’s what’s interesting about doing these simulations at widely different scales,” Robertson said. “We can calibrate after the fact to inform ourselves in how we might be getting the story wrong with the coarser, larger simulation.”

Credit: olcf.ornl.gov

Sun Shreds Its Own Eruption

Sun Shreds Its Own Eruption:


On September 30, 2014, multiple NASA observatories watched what appeared to be the beginnings of a solar eruption. A filament — a serpentine structure consisting of dense solar material and often associated with solar eruptions — rose from the surface, gaining energy and speed as it soared. But instead of erupting from the Sun, the filament collapsed, shredded to pieces by invisible magnetic forces. Credits: NASA’s Goddard Space Flight Center/Genna Duberstein, producer


On Sept. 30, 2014, multiple NASA observatories watched what appeared to be the beginnings of a solar eruption. A filament — a serpentine structure consisting of dense solar material and often associated with solar eruptions — rose from the surface, gaining energy and speed as it soared. But instead of erupting from the Sun, the filament collapsed, shredded to pieces by invisible magnetic forces.

Because scientists had so many instruments observing the event, they were able to track the entire event from beginning to end, and explain for the first time how the Sun’s magnetic landscape terminated a solar eruption. Their results are summarized in a paper published in The Astrophysical Journal on July 10, 2017.

“Each component of our observations was very important,” said Georgios Chintzoglou, lead author of the paper and a solar physicist at Lockheed Martin Solar and Astrophysics Laboratory in Palo Alto, California, and the University Corporation for Atmospheric Research in Boulder, Colorado. “Remove one instrument, and you’re basically blind. In solar physics, you need to have good coverage observing multiple temperatures — if you have them all, you can tell a nice story.”

The study makes use of a wealth of data captured by NASA’s Solar Dynamics Observatory, NASA’s Interface Region Imaging Spectrograph, JAXA/NASA’s Hinode, and several ground-based telescopes in support of the launch of the NASA-funded VAULT2.0 sounding rocket. Together, these observatories watch the Sun in dozens of different wavelengths of light that reveal the Sun’s surface and lower atmosphere, allowing scientists to track the eruption from its onset up through the solar atmosphere — and ultimately understand why it faded away.

The day of the failed eruption, scientists pointed the VAULT2.0 sounding rocket — a sub-orbital rocket that flies for some 20 minutes, collecting data from above Earth’s atmosphere for about five of those minutes — at an area of intense, complex magnetic activity on the Sun, called an active region. The team also collaborated with IRIS to focus its observations on the same region.

“We were expecting an eruption; this was the most active region on the Sun that day,” said Angelos Vourlidas, an astrophysicist at the Johns Hopkins University Applied Physics Laboratory in Laurel, Maryland, principal investigator of the VAULT2.0 project and co-author of the paper. “We saw the filament lifting with IRIS, but we didn’t see it erupt in SDO or in the coronagraphs. That’s how we knew it failed.” 

The Sun’s landscape is controlled by magnetic forces, and the scientists deduced the filament must have met some magnetic boundary that prevented the unstable structure from erupting. They used these observations as input for a model of the Sun’s magnetic environment. Much like scientists who use topographical data to study Earth, solar physicists map out the Sun’s magnetic features, or topology, to understand how these forces guide solar activity.

Chintzoglou and his colleagues developed a model that identified locations on the Sun where the magnetic field was especially compressed, since rapid releases of energy — such as those they observed when the filament collapsed — are more likely to occur where magnetic field lines are strongly distorted.

“We computed the Sun’s magnetic environment by tracing millions of magnetic field lines and looking at how neighboring field lines connect and diverge,” said Antonia Savcheva, an astrophysicist at the Harvard-Smithsonian Center for Astrophysics in Cambridge, Massachusetts, and co-author of the paper. “The amount of divergence gives us a measure of the topology.”

Their model shows this topology shapes how solar structures evolve on the Sun’s surface. Typically, when solar structures with opposite magnetic orientations collide, they explosively release magnetic energy, heating the atmosphere with a flare and erupting into space as a coronal mass ejection — a massive cloud of solar material and magnetic fields.

But on the day of the Sept. 2014 near-eruption, the model indicated the filament instead pushed up against a complex magnetic structure, shaped like two igloos smashed against each other. This invisible boundary, called a hyperbolic flux tube, was the result of a collision of two bipolar regions on the sun’s surface — a nexus of four alternating and opposing magnetic fields ripe for magnetic reconnection, a dynamic process that can explosively release great amounts of stored energy.

“The hyperbolic flux tube breaks the filament’s magnetic field lines and reconnects them with those of the ambient Sun, so that the filament’s magnetic energy is stripped away,” Chintzoglou said.

This structure eats away at the filament like a log grinder, spraying chips of solar material and preventing eruption. As the filament waned, the model demonstrates heat and energy were released into the solar atmosphere, matching the initial observations. The simulated reconnection also supports the observations of bright flaring loops where the hyperbolic flux tube and filament met — evidence for magnetic reconnection.

While scientists have speculated such a process exists, it wasn’t until they serendipitously had multiple observations of such an event that they were able to explain how a magnetic boundary on the Sun is capable of halting an eruption, stripping a filament of energy until it’s too weak to erupt.

“This result would have been impossible without the coordination of NASA’s solar fleet in support of our rocket launch,” Vourlidas said.

This study indicates the Sun’s magnetic topology plays an important role in whether or not an eruption can burst from the Sun. These eruptions can create space weather effects around Earth. 

“Most research has gone into how topology helps eruptions escape,” Chintzoglou said. “But this tells us that apart from the eruption mechanism, we also need to consider what the nascent structure encounters in the beginning, and how it might be stopped.”

Credit: NASA

TRAPPIST-1 is Older Than Our Solar System

TRAPPIST-1 is Older Than Our Solar System:


This artist's concept shows what the TRAPPIST-1 planetary system may look like, based on available data about the planets’ diameters, masses and distances from the host star. The system has been revealed through observations from NASA's Spitzer Space Telescope and the ground-based TRAPPIST (TRAnsiting Planets and PlanetesImals Small Telescope) telescope, as well as other ground-based observatories. The system was named for the TRAPPIST telescope. Credit: NASA/JPL-Caltech/R. Hurt, T. Pyle (IPAC)


If we want to know more about whether life could survive on a planet outside our solar system, it’s important to know the age of its star. Young stars have frequent releases of high-energy radiation called flares that can zap their planets' surfaces. If the planets are newly formed, their orbits may also be unstable. On the other hand, planets orbiting older stars have survived the spate of youthful flares, but have also been exposed to the ravages of stellar radiation for a longer period of time.

Scientists now have a good estimate for the age of one of the most intriguing planetary systems discovered to date -- TRAPPIST-1, a system of seven Earth-size worlds orbiting an ultra-cool dwarf star about 40 light-years away. Researchers say in a new study that the TRAPPIST-1 star is quite old: between 5.4 and 9.8 billion years. This is up to twice as old as our own solar system, which formed some 4.5 billion years ago.

The seven wonders of TRAPPIST-1 were revealed earlier this year in a NASA news conference, using a combination of results from the Transiting Planets and Planetesimals Small Telescope (TRAPPIST) in Chile, NASA's Spitzer Space Telescope, and other ground-based telescopes. Three of the TRAPPIST-1 planets reside in the star’s "habitable zone," the orbital distance where a rocky planet with an atmosphere could have liquid water on its surface. All seven planets are likely tidally locked to their star, each with a perpetual dayside and nightside.

At the time of its discovery, scientists believed the TRAPPIST-1 system had to be at least 500 million years old, since it takes stars of TRAPPIST-1’s low mass (roughly 8 percent that of the Sun) roughly that long to contract to its minimum size, just a bit larger than the planet Jupiter. However, even this lower age limit was uncertain; in theory, the star could be almost as old as the universe itself. Are the orbits of this compact system of planets stable? Might life have enough time to evolve on any of these worlds?

"Our results really help constrain the evolution of the TRAPPIST-1 system, because the system has to have persisted for billions of years. This means the planets had to evolve together, otherwise the system would have fallen apart long ago," said Adam Burgasser, an astronomer at the University of California, San Diego, and the paper's first author. Burgasser teamed up with Eric Mamajek, deputy program scientist for NASA's Exoplanet Exploration Program based at NASA's Jet Propulsion Laboratory, Pasadena, California, to calculate TRAPPIST-1's age. Their results will be published in The Astrophysical Journal.

It is unclear what this older age means for the planets' habitability. On the one hand, older stars flare less than younger stars, and Burgasser and Mamajek confirmed that TRAPPIST-1 is relatively quiet compared to other ultra-cool dwarf stars. On the other hand, since the planets are so close to the star, they have soaked up billions of years of high-energy radiation, which could have boiled off atmospheres and large amounts of water. In fact, the equivalent of an Earth ocean may have evaporated from each TRAPPIST-1 planet except for the two most distant from the host star: planets g and h. In our own solar system, Mars is an example of a planet that likely had liquid water on its surface in the past, but lost most of its water and atmosphere to the Sun’s high-energy radiation over billions of years.

However, old age does not necessarily mean that a planet's atmosphere has been eroded. Given that the TRAPPIST-1 planets have lower densities than Earth, it is possible that large reservoirs of volatile molecules such as water could produce thick atmospheres that would shield the planetary surfaces from harmful radiation. A thick atmosphere could also help redistribute heat to the dark sides of these tidally locked planets, increasing habitable real estate. But this could also backfire in a "runaway greenhouse" process, in which the atmosphere becomes so thick the planet surface overheats – as on Venus.

"If there is life on these planets, I would speculate that it has to be hardy life, because it has to be able to survive some potentially dire scenarios for billions of years," Burgasser said.

Fortunately, low-mass stars like TRAPPIST-1 have temperatures and brightnesses that remain relatively constant over trillions of years, punctuated by occasional magnetic flaring events. The lifetimes of tiny stars like TRAPPIST-1 are predicted to be much, much longer than the 13.7 billion-year age of the universe (the Sun, by comparison, has an expected lifetime of about 10 billion years).

"Stars much more massive than the Sun consume their fuel quickly, brightening over millions of years and exploding as supernovae," Mamajek said. "But TRAPPIST-1 is like a slow-burning candle that will shine for about 900 times longer than the current age of the universe."

Some of the clues Burgasser and Mamajek used to measure the age of TRAPPIST-1 included how fast the star is moving in its orbit around the Milky Way (speedier stars tend to be older), its atmosphere’s chemical composition, and how many flares TRAPPIST-1 had during observational periods. These variables all pointed to a star that is substantially older than our Sun.

Future observations with NASA's Hubble Space Telescope and upcoming James Webb Space Telescope may reveal whether these planets have atmospheres, and whether such atmospheres are like Earth's.

"These new results provide useful context for future observations of the TRAPPIST-1 planets, which could give us great insight into how planetary atmospheres form and evolve, and persist or not," said Tiffany Kataria, exoplanet scientist at JPL, who was not involved in the study.

Future observations with Spitzer could help scientists sharpen their estimates of the TRAPPIST-1 planets’ densities, which would inform their understanding of their compositions.

Scientists Help Predict Neptune’s Chemical Make-Up

Scientists Help Predict Neptune’s Chemical Make-Up:


This picture of Neptune was produced from the last whole planet images taken through the green and orange filters on the Voyager 2 narrow angle camera. Credit: NASA


Scientists have helped solve the mystery of what lies beneath the surface of Neptune - the most distant planet in our solar system. A new study sheds light on the chemical make-up of the planet, which lies around 4.5 billion kilometers from the sun.

Extremely low temperatures on planets like Neptune - called ice giants - mean that chemicals on these distant worlds exist in a frozen state, researchers say.

Frozen mixtures of water, ammonia and methane make up a thick layer between the planets' atmosphere and core - known as the mantle. However, the form in which these chemicals are stored is poorly understood.

Using laboratory experiments to study these conditions is difficult, as it is very hard to recreate the extreme pressures and temperatures found on ice giants, researchers say.

Instead, scientists at the University of Edinburgh ran large-scale computer simulations of conditions in the mantle. By looking at how the chemicals there react with each other at very high pressures and low temperatures, they were able to predict which compounds are formed in the mantle.

The team found that frozen mixtures of water and ammonia inside Neptune - and other ice giants, including Uranus - are likely to form a little-studied compound called ammonia hemihydrate.

The findings will influence how ice giants are studied in future and could help astronomers classify newly discovered planets as they look deeper into space.

The study, published in the journal Proceedings of the National Academy of Sciences, was supported by Engineering and Physical Sciences Research Council. The work was carried out in collaboration with scientists at Jilin University, China.

Dr Andreas Hermann, of the University of Edinburgh's Centre for Science at Extreme Conditions, said: "This study helps us better predict what is inside icy planets like Neptune. Our findings suggest that ammonia hemihydrate could be an important component of the mantle in ice giants, and will help improve our understanding of these frozen worlds. Computer models are a great tool to study these extreme places, and we are now building on this study to get an even more complete picture of what goes on there."

Credit: ed.ac.uk

Gravitational Waves as Astronomical Tools: LIGO Team Members Awarded 2018 Berkeley Prize

Gravitational Waves as Astronomical Tools: LIGO Team Members Awarded 2018 Berkeley Prize:


The collision of two black holes holes—a tremendously powerful event detected for the first time ever by the Laser Interferometer Gravitational-Wave Observatory, or LIGO—is seen in this still from a computer simulation. LIGO detected gravitational waves, or ripples in space and time generated as the black holes spiraled in toward each other, collided, and merged. This simulation shows how the merger would appear to our eyes if we could somehow travel in a spaceship for a closer look. It was created by solving equations from Albert Einstein's general theory of relativity using the LIGO data. Image Credit: SXS, the Simulating eXtreme Spacetimes (SXS) project (http://www.black-holes.org)


The importance of the discovery of gravitational waves is being more widely recognized by the scientific community. Recently, the American Astronomical Society (AAS) has awarded the 2018 Berkeley Prize to three researchers for their leadership roles in the development of the Advanced LIGO detectors, which have opened a new window on the universe. This decision marks the significance of gravitational waves for future research in the field of astronomy.

AAS announced in late July that Dennis C. Coyne (Caltech), Peter K. Fritschel (MIT), and David H. Shoemaker (MIT) will share the 2018 Lancelot M. Berkeley - New York Community Trust Prize for Meritorious Work in Astronomy. This trio of researchers represents the team that developed the second-generation detectors for the Laser Interferometer Gravitational-Wave Observatory (LIGO) and used them to detect oscillations in the fabric of space-time.

“It is of course a personal pleasure, and I am very happy they chose the three persons they did — we worked very closely and in a complementary fashion to guide the project to a successful conclusion,” Shoemaker told Astrowatch.net.

Shoemaker is the title Senior Research Scientist at MIT’s Kavli Institute for Astrophysics and Space Research. Moreover, he led the Advanced LIGO team and serves as Spokesperson for the LIGO Scientific Collaboration (LSC), which includes nearly 1,200 scientists from more than 100 institutions and 18 countries worldwide.

“The LSC is charged to ‘do the science’ — instrument science as well as astrophysics — and the LIGO Lab (part of the LSC) has the ‘niche’ responsibility to make projects happen, maintain the observatories, and generally manage the machinery that makes us an observatory. That is a great complement to the approximately 100 other groups in the LSC who work to solve problems on many scales to get the science done,” Shoemaker said.

Shoemaker underlined how challenging was the development of the new LIGO detectors. It required a lot of work from the team and it cost them a lot of stress few times when things did not go as planned. He noted that people participating in the project were fantastic and the dedication of everyone involved, including technicians, junior engineers, administrative staff, and others, was phenomenal.


Left to right: Dennis Coyne, Peter Fritschel, and David Shoemaker

“I would like also to mention Carol Wilkinson, who served as Project Manager for much of the project. It is not easy to spend more than 200 million dollars legally, efficiently, and to communicate that to the funding agencies in review panels. Carol did all that and more,” Shoemaker said.

He pointed out that the award shows the work done by the LIGO team was acknowledged by astronomical community as the Berkeley Prize is given by a society of professional astronomers.

“Most important for me though is the source of the prize: the American Astronomical Society. I could not be happier that the organization sponsoring the prize is one led by and serving the astronomy community — it shows that the gravitational-wave field is starting to be considered an astronomical tool and not just a demonstration of general relativity,” Shoemaker said.

Gravitational waves are 'ripples' in the fabric of space-time caused by some of the most violent and energetic processes in the universe. So far, the LIGO team has announced three confirmed detections of cosmic gravitational waves, all from merging pairs of massive black holes.

“Einstein’s General Theory of Gravitation makes predictions that are, as far as we can tell, exactly right, even in the case of pure warped space-time. That is astonishing. Add to that the fact that there are bigger stellar-mass black holes than most anyone predicted, and you have a new field,” Shoemaker concluded.

Asteroid Apophis Has One in 100,000 Chance of Hitting Earth, Expert Estimates

Asteroid Apophis Has One in 100,000 Chance of Hitting Earth, Expert Estimates:


Goldstone radar images of asteroid Apophis. Image credit: JPL


The huge nearly 400-meter wide asteroid Apophis is still on a list of hazardous near-Earth objects (NEOs), regarded as a potential threat to our planet. However, new calculations made by NASA’s Jet Propulsion Laboratory (JPL) scientist, show that Apophis’ odds of Earth impact are lower than previously estimated.

“We cannot yet exclude the possibility that it could impact our planet, but we can calculate that the chance of Earth impact is only a 1-in-100-thousand over the next century, which of course is extremely small,” Paul Chodas, Manager of JPL’s Center for Near Earth Object Studies told Astrowatch.net.

Discovered in 2004, asteroid Apophis is slated to fly by our planet on April 13, 2029. Initial observations of this space rock indicated that it has one in 36 chance of hitting the Earth on that day, but additional monitoring of Apophis completely ruled out this possibility.

However, Alberto Cellino of the Observatory of Turin in Italy told Astrowatch.net in June, that although the potential impact in 2029 was excluded, we cannot rule out such event in more distant future. Given the fact that NEO orbits are chaotic, what is not dangerous today can become a candidate impactor in the future.

That is why astronomers, including Chodas, underline the importance of detailed observations of Apophis and its constant monitoring, which could confirm that this asteroid poses no danger to us.

“Apophis is certainly a hazardous asteroid, and for that reason it has been tracked extensively, and so we know its orbit very accurately. In all likelihood further tracking measurements will eliminate even that possibility (one in 100,000), Chodas noted.

Astronomers estimate that on April 13, 2029, Apophis will pass by the Earth at a distance of no closer than 18,300 miles (29,470 kilometers). Next close approach of this asteroid is expected to take place in April 2036 when it will miss our planet at a much larger distance of approximately 30.5 million miles (49 million kilometers).

Currently, there are 1,803 potentially hazardous asteroids (PHAs) detected to date. PHAs are space rocks larger than approximately 100 meters that can come closer to Earth than 4.65 million miles (7.5 million kilometers). However, none of the known PHAs is on a collision course with our planet.

Experiments Cast Doubt on How the Earth Was Formed

Experiments Cast Doubt on How the Earth Was Formed:


esa-earth-from-space.jpg


New geochemical research indicates that existing theories of the formation of the Earth may be mistaken. The results of experiments to show how zinc (Zn) relates to sulphur (S) under the conditions present at the time of the formation of the Earth more than 4 billion years ago, indicate that there is a substantial quantity of Zn in the Earth's core, whereas previously there had been thought to be none. This implies that the building blocks of the Earth must be different to what has been supposed. The work is presented at the Goldschmidt geochemistry conference in Paris.

The researchers, from the Institut de Physique du Globe de Paris (IPGP) melted mixtures of iron-rich metal and silicate compounds, containing Zn and S, at high temperatures and pressures up to 80 GPa and 4100 K to experimentally simulate core-mantle differentiation at the time of the Earth's formation. They then measured how these elements were distributed (partitioned) between the core and mantle of their experiments. When they fed their results into computer models of the Earth's formation, they found that none of the canonical models can sufficiently reproduce the S/Zn ratio of the present-day mantle. This means that the current estimates of the Earth's composition, including its core, need to be modified, and therefore the way the core and mantle - i.e. the Earth - formed may also need to be revised.

"Most theories are based on the Earth being formed from only two types of stony meteorite, the CI chondrites or enstatite chondrites. However, this new work indicates that the Earth needs to have formed from a more S-poor source; in terms of the geochemistry, the best candidate for this material is the metal rich CH chondrites", said Brandon Mahan (Institut de Physique du Globe de Paris).

"CH chondrites were first classified in 1985, and only a few dozen examples have been identified. They are rich in metallic iron and poor in easily vaporized elements, which indicates formation at very high temperatures, but they also contain a few percent of water-bearing minerals, which paradoxically indicates low temperatures.

This means that the CH chondrites -- much like the Earth -- have a very complex formation history which has given them features from both extremes of hot and cold. If our results are valid, this indicates that the building blocks of the Earth may be a bit more exotic than we thought" Existing theories of the Earth's formation are largely based on geochemistry. One of the major geochemical clues to the Earth's formation lies in the way elements such as Zn and S in meteorites are associated in a relatively well-known ratio, meaning that if you know the amount of Zn in a meteorite, you can estimate the amount of S. "We decided to test if that ratio was the same for the growing Earth as it is today using various possible source materials.", said Brandon Mahan.

"We found that under conditions similar to those estimated when the Earth formed, Zn has a tendency to be distributed between the core and mantle differently than we had thought, i.e. there will be a significant amount of it bound up in the Earth's core. Based on previous models, if we can place more Zn in the core, then by association you place more S in the core as well, much more in fact than most current observations suggest.

Most leading estimates cap the amount of sulphur in the Earth's core at around 2%. If this is true, then using most known meteorites as a source material for Earth puts the S/Zn ratio of the mantle way above current accepted values, because too much S ends up in the mantle, indicating that perhaps the Earth cannot be made from any of the solar system materials that have previously been proposed as its source material.

But if the building blocks of the Earth were something like the CH Chondrites, this could give us an Earth pretty similar to the one we see today."

New 3-D Simulations Show How Galactic Centers Cool Their Jets

New 3-D Simulations Show How Galactic Centers Cool Their Jets:


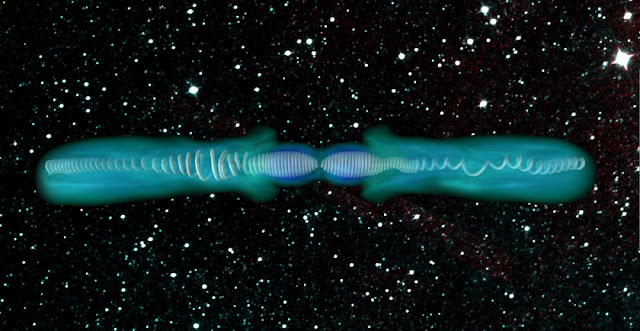
This rendering illustrates magnetic kink instability in simulated jets beaming from a galaxy’s center. The jets are believed to be associated with supermassive black holes. The magnetic field line (white) in each jet is twisted as the central object (black hole) rotates. As the jets contact higher-density matter the magnetic fields build up and become unstable. The irregular bends and asymmetries of the magnetic field lines are symptomatic of kink instability. The instability dissipates the magnetic fields into heat with the change in density, leading them to become less tightly wound. (Credit: Berkeley Lab, Purdue University, NASA)


Some of the most extreme outbursts observed in the universe are the mysterious jets of energy and matter beaming from the center of galaxies at nearly the speed of light. These narrow jets, which typically form in opposing pairs are believed to be associated with supermassive black holes and other exotic objects, though the mechanisms that drive and dissipate them are not well understood. Now, a small team of researchers has developed theories supported by 3-D simulations to explain what’s at work.

“These jets are notoriously hard to explain,” said Alexander “Sasha” Tchekhovskoy, a former NASA Einstein fellow who co-led the new study as a member of the Nuclear Science Division at the Department of Energy’s Lawrence Berkeley National Laboratory (Berkeley Lab), and the Astronomy and Physics departments and Theoretical Astrophysics Center at UC Berkeley. “Why are they so stable in some galaxies and in others they just fall apart?”

As much as half of the jets’ energy can escape in the form of X-rays and stronger forms of radiation. The researchers showed how two different mechanisms – both related to the jets’ interaction with surrounding matter, known as the “ambient medium” – serve to reduce about half of the energy of these powerful jets.

“The exciting part of this research is that we are now coming to understand the full range of dissipation mechanisms that are working in the jet,” no matter the size or type of jet, he said.

The study that Tchekhovskoy co-led with Purdue University scientists Rodolfo Barniol Duran and Dimitrios Giannios is published in the Aug. 21 edition of Monthly Notices of the Royal Astronomical Society. The study concludes that the ambient medium itself has a lot to do with how the jets release energy.

“We were finally able to simulate jets that start from the black hole and propagate to very large distances – where they bump into the ambient medium,” said Duran, formerly a postdoctoral research associate at Purdue University who is now a faculty member at California State University, Sacramento.

Tchekhovskoy, who has studied these jets for over a decade, said that an effect known as magnetic kink stability, which causes a sudden bend in the direction of some jets, and another effect that triggers a series of shocks within other jets, appear to be the primary mechanisms for energy release. The density of the ambient medium that the jets encounter serves as the key trigger for each type of release mechanism.

“For a long time, we have speculated that shocks and instabilities trigger the spectacular light displays from jets. Now these ideas and models can be cast on a much firmer theoretical ground,” said Giannios, assistant professor of physics and astronomy at Purdue.

The length and intensity of the jets can illuminate the properties of their associated black holes, such as their age and size and whether they are actively “feeding” on surrounding matter. The longest jets extend for millions of light years into surrounding space.

“When we look at black holes, the first things we notice are the central streaks of these jets. You can make images of these streaks and measure their lengths, widths, and speeds to get information from the very center of the black hole,” Tchekhovskoy noted. “Black holes tend to eat in binges of tens and hundreds of millions of years. These jets are like the ‘burps’ of black holes – they are determined by the black holes’ diet and frequency of feeding.”

While nothing – not even light – can escape a black hole’s interior, the jets somehow manage to draw their energy from the black hole. The jets are driven by a sort of accounting trick, he explained, like writing a check for a negative amount and having money appear in your account. In the black hole’s case, it’s the laws of physics rather than a banking loophole that allow black holes to spew energy and matter even as they suck in surrounding matter.

The incredible friction and heating of gases spiraling in toward the black hole cause extreme temperatures and compression in magnetic fields, resulting in an energetic backlash and an outflow of radiation that escapes the black hole’s strong pull.

Earlier studies had shown how magnetic instabilities (kinks) in the jets can occur when jets run into the ambient medium. This instability is like a magnetic spring. If you squish the spring from both ends between your fingers, the spring will fly sideways out of your hand. Likewise, a jet experiencing this instability can change direction when it rams into matter outside of the black hole’s reach.

The same type of instability frustrated scientists working on early machines that attempted to create and harness a superhot, charged state of matter known as a plasma in efforts to develop fusion energy, which powers the sun. The space jets, also known as active galactic nuclei (AGN) jets, also are a form of plasma.

The latest study found that in cases where an earlier jet had “pre-drilled” a hole in the ambient medium surrounding a black hole and the matter impacted by the newly formed jet was less dense, a different process is at work in the form of “recollimation” shocks.

These shocks form as matter and energy in the jet bounce off the sides of the hole. The jet, while losing energy from every shock, immediately reforms a narrow column until its energy eventually dissipates to the point that the beam loses its tight focus and spills out into a broad area.

“With these shocks, the jet is like a phoenix. It comes out of the shock every time,” though with gradually lessening energy, Tchekhovskoy said. “This train of shocks cumulatively can dissipate quite a substantial amount of the total energy.”

The researchers designed the models to smash against different densities of matter in the ambient medium to create instabilities in the jets that mimic astrophysical observations.

New, higher-resolution images of regions in space where supermassive black holes are believed to exist – from the Event Horizon Telescope (EHT), for example – should help to inform and improve models and theories explaining jet behavior, Tchekhovskoy said, and future studies could also include more complexity in the jet models, such as a longer sequence of shocks.

“It would be really interesting to include gravity into these models,” he said, “and to see the dynamics of buoyant cavities that the jet fills up with hot magnetized plasma as it drills a hole” in the ambient medium.
He added, “Seeing deeper into where the jets come from – we think the jets start at the black hole’s event horizon (a point of no return for matter entering the black hole) – would be really helpful to see in nature these ‘bounces’ in repeating shocks, for example. The EHT could resolve this structure and provide a nice test of our work.”

Credit: lbl.gov

Supernova Hunters: 'Get Them While They're Young'

Supernova Hunters: 'Get Them While They're Young':


Bright blue dot: Supernovae such as SN 2017cbv appear as "stars that weren't there before," which is why multiple images taken over time are necessary to reveal their true identity. SN 2017cbv lies in the outskirts of a spiral galaxy called NGC 5643 that lies about 55 million light-years away and has about the same diameter as the Milky Way (~100,000 light-years). Data are from the Las Cumbres Observatory Global Supernova Project and the Carnegie-Irvine Galaxy Survey. (Credit: B.J. Fulton/Caltech)


Not many people can say they have watched a star explode before their eyes, but David Sand can. On the evening of March 10, the astronomer happened to be on duty to monitor results coming in from an automated survey scanning faraway galaxies for evidence of such events. Sand was about to go to bed, when the software algorithm alerted him to a point of light where none had been just a few hours earlier, in a galaxy called NGC 5643, located in the constellation Lupus, 55 million light-years from Earth.

"As I was looking at this image, it was clear to me a supernova had just gone off," said Sand, who joined the University of Arizona's Steward Observatory just this month as a new assistant professor. "I took another image right away to get a confirmation."

Because some blips of light that show up unexpectedly in the observations turn out to be asteroids passing in front of the star-studded background and not stellar cataclysms, Sand sent a remote command to the telescope, located at the Cerro Tololo Observatory in Chile, to snap another image. The blip was still there. 

Within minutes of discovery, Sand activated observations with the global network of 18 robotic telescopes of the Las Cumbres Observatory. They are spaced around the globe so that there is always one on the night side of the Earth, ready to conduct astronomical observations. This allowed the team to take immediate and near-continuous observations. 

"In a galaxy like our Milky Way, a supernova goes off, on average, about once per century," Sand said. "We were fortunate to see this phenomenon that never had been observed before." 

Sand's discovery, designated SN 2017cbv, likely marks the first detailed observation of a cosmic event that astronomers only had glimpses of before: a supernova and its explosive ejecta slamming into a nearby companion star. The discovery was made possible by a specialized survey taking advantage of recent advances in linking telescopes across the globe into a robotic network. 

At 55 million light-years, SN 2017cbv was one of the closest supernovae discovered in recent years. It was found by the DLT40 survey, which stands for "Distance Less Than 40 Megaparsecs" or 120 million light-years. The survey uses the PROMPT telescope in Chile, which monitors roughly 500 galaxies nightly. 

"This was one of the earliest catches ever — within a day, perhaps even hours, of its explosion," said Sand, who created the DLT40 survey together with Stefano Valenti, an assistant professor at the University of California, Davis. Both were previously postdoctoral researchers at Las Cumbres Observatory, or LCO. 

SN 2017cbv is a thermonuclear (Type Ia) supernova, the type astronomers use to measure the acceleration of the expansion of the universe. Type Ia supernovae are known to be the explosions of white dwarfs, the dead cores of what used to be normal stars. 

Across the cosmic abyss, a supernova tells of its existence by appearing like a star that wasn't there before. Its brightness peaks within a matter of days to weeks and then slowly fades over weeks or months.

"To turn into a Type Ia supernova, a white dwarf can't be by itself," explained Sand, who serves as the principal investigator of the DLT40 survey. "It has to have some kind of companion, and we are trying to figure out what that companion is."

The identity of this companion has been hotly debated for more than 50 years. 

The prevailing theory over the last few years is that the supernovae happen when two white dwarfs spiral in toward each other and merge in a cataclysmic explosion. The other scenario involves a normal star that is not a white dwarf.

Key to the observations reported in this study is a small bump in the light curve emitted by SN 2017cbv within the first three to four days, a feature that would have been missed were it not for the almost instantaneous reaction times that are the hallmark of the DLT40 survey: a fleeting blue glow from the interaction at an unprecedented level of detail, revealing the surprising identity of the mysterious companion star. 

"We think what happened here was likely scenario number two," Sand said. "The bump in the light curve could be caused by material from the exploding white dwarf as it slams into the companion star." 

This study infers that the white dwarf was stealing matter from a much larger companion star, approximately 20 times the radius of the sun. This caused the white dwarf to explode, and the collision of the supernova with the companion star shocked the supernova material, heating it to a blue glow that was heavy in ultraviolet light. Such a shock could not have been produced if the companion were another white dwarf star, the study's authors say. 

"We've been looking for this effect — a supernova crashing into its companion star — since it was predicted in 2010," said Griffin Hosseinzadeh, a doctoral student at the University of California, Santa Barbara, who led the study, which is soon to be published in the Astrophysical Journal Letters. "Hints have been seen before, but this time the evidence is overwhelming. The data are beautiful! 

"With Las Cumbres Observatory's ability to monitor the supernova every few hours, we were able to see the full extent of the rise and fall of the blue glow for the first time," he added. "Conventional telescopes would have had only a data point or two and missed it."

Eighteen telescopes, spread over eight sites around the world, form the heart of the Las Cumbres Observatory. At any given moment, it is nighttime somewhere in the network, which ensures that a supernova can be observed without interruption. 

Because of their uniform brightness, Type Ia supernovae are akin to a "standard 60-watt lightbulb for cosmology," and scientists use them as yardsticks to measure distances across the universe. 

Because of their rare and fleeting appearance, a targeted observational campaign such as the DLT40 survey and an automated network of observatories such as the LCO are critical to the discovery and study of Type Ia supernovae. Funded by the National Science Foundation, the DLT40 survey started in October 2016 and is scheduled to continue over the next three years.

"The secret sauce to this are the connected telescopes of the Las Cumbres Observatory," Sand said, adding that the survey is not about quantity. "We'd rather focus on a precious few than hundreds of them."

It is likely that Type Ia supernovae come from both types of progenitor systems — two white dwarfs or one white dwarf and a "normal" interacting star — and the goal of these studies is to figure out which of the two processes is more common, Sand explained. 

"Observing supernovae such as SN 2017cbv is an important step in this direction," he said. "If we get them really young, we can get a better idea of these processes, which hold implications for our understanding of the cosmos, including dark energy." 

Credit: arizona.edu

Asteroid 2017 PK25 Flew Past Earth Today

Asteroid 2017 PK25 Flew Past Earth Today:


asteroid-apophis-illustration.jpg


An asteroid discovered just two days ago safely flew past Earth today at 2:08 UTC at a distance of 2.2 lunar distances (LD), or 845,000 kilometers. The object, known as 2017 PK25, missed our planet with a relative velocity of approximately 16 km/s.

2017 PK25 was first observed by the Asteroid Terrestrial-Impact Last Alert System (ATLAS) at the Mauna Loa Observatory (MLO), Hawaii. It is an astronomical survey system for detection of dangerous asteroids a few weeks to days before their close approaches to Earth.

According to astronomers, 2017 PK25 has an estimated diameter between 23 and 52 meters, and an absolute magnitude of 25.3. The asteroid has a semimajor axis of 0.81 and it takes it about 266 days to fully circle the sun.

Besides passing today near our planet, the asteroid also missed the moon few hours earlier at nearly identical distance of about 2.1 LD. Next close approach of 2017 PK25 is expected on Aug. 4, 2020 when it will whiz by Earth at a much larger distance of 133 LD.

Currently, there are 1,803 potentially hazardous asteroids (PHAs) detected to date. PHAs are space rocks larger than approximately 100 meters that can come closer to Earth than 19.5 LD. However, none of the known PHAs is on a collision course with our planet.

Researchers Redefine Cosmic Velocity Web

Researchers Redefine Cosmic Velocity Web:


The cosmic velocity web is represented by surfaces of knots in red and surfaces of filaments in gray. The black lines with arrows illustrate local velocity flows within filaments and toward knots. The Laniakea Supercluster basin of attraction that includes our Milky Way galaxy is represented by a blue surface. The region being displayed extends across one billion light years.  Credit: Daniel Pomarede, Yehuda Hoffman, R. Brent Tully and Helene Courtois.


The cosmic web -- the distribution of matter on the largest scales in the universe -- has usually been defined through the distribution of galaxies. Now, a new study by a team of astronomers from France, Israel and Hawaii demonstrates a novel approach. Instead of using galaxy positions, they mapped the motions of thousands of galaxies. Because galaxies are pulled toward gravitational attractors and move away from empty regions, these motions allowed the team to locate the denser matter in clusters and filaments and the absence of matter in regions called voids.

Matter was distributed almost homogeneously in the very early universe, with only miniscule variations in density. Over the 14-billion-year history of the universe, gravity has been acting to pull matter together in some places and leave other places more and more empty. Today, the matter forms a network of knots and connecting filaments referred to as the cosmic web. Most of this matter is in a mysterious form, the so-called "dark matter." Galaxies have formed at the highest concentrations of matter and act as lighthouses illuminating the underlying cosmic structure.

The newly defined cosmic velocity web defines the structure of the universe from velocity information alone. In those regions with abundant observations, the structure of the velocity web and the web inferred from the locations of the galaxy lighthouses are similar. This agreement provides strong confirmation of the fundamental idea that structure developed from the growth of initially tiny fluctuations through gravitational attraction.

The cosmic velocity web analysis was led by Daniel Pomarede, Atomic Energy Center, France, with the collaboration of Helene Courtois at the University of Lyon, France; Yehuda Hoffman at the Hebrew University, Israel; and Brent Tully at the University of Hawai'i's Institute for Astronomy.

"With the motions of the galaxies, we can infer where all of the mass is located: the galaxies and the 5 times more abundant transparent matter (usually wrongly called dark matter). This total gravitating mass, together with the expansion of the universe, is responsible for the motions that create the architecture of the universe. The gravity from galaxies alone cannot create this network we see," said Dr. Courtois.

Dr. Tully adds, "Moreover, a wide swath of the universe is hidden behind the obscuring disk of our own Milky Way galaxy. Our reconstruction of structure with the velocity web is revealing for the first time filaments of matter that stretch all the way around the sky and are easily followed through these regions of obscuration."

This definition of the cosmic velocity web was made possible by the large and coherent collection of galaxy distances and velocities in the Cosmicflows series. The current analysis is based on a study of 8,000 galaxies in the second release of Cosmicflows. The third release, with over twice as many galaxy distances and velocities is already available, and will reveal the cosmic velocity web in increasingly rich detail.

The key element of the program is the acquisition of good distances to galaxies. Several methods are used, such as exploiting the known luminosities of old stars that are just beginning to burn Helium in their cores, and the relationship between the rotation speed of galaxies and the number of stars they possess. The observations have involved dozens of telescopes around the world and in space and at wavelengths from visible light through the infrared to radio.

"The velocity web method for mapping the cosmos is analogous to using plate tectonics in geology. It helps understand not just the current layout of the universe, but also the movement of the invisible underlying masses responsible for that topology," said Dr. Courtois.

The team has produced an extensive video demonstrating the cosmic velocity web. It first explains the concepts underlying the cosmic velocity web reconstruction, followed by a description of its major elements. The video then shows how cosmic flows are organized within its structure, and how the basin of attraction of the recently mapped Laniakea Supercluster resides within its elements. In the final sequence, the viewer enters an immersive exploration of the filamentary structure of the local universe, navigating inside the filaments and visiting the major nodes such as the Great Attractor. The 11-minute video is linked below and available at https://vimeo.com/pomarede/vweb.

The 3-dimensional map can also be explored in an interactive visualization, using the free online Sketchfab platform. This is a powerful tool to visualize interactively the structure from any viewpoint and compare it with the distribution of galaxies; one can dive inside the filaments and explore them in immersion. With appropriate virtual reality hardware, it can also be used in VR mode. This visualization marks a milestone as the first time such an interactive dataset will be embedded in the online version of the scientific article appearing in the Astrophysical Journal. Everyone is invited to interact with the data below, or at https://skfb.ly/667Jr.

The team of researchers includes Yehuda Hoffman, Hebrew University's Racah Institute of Physics, Daniel Pomarède, Institut de Recherche sur les Lois Fondamentales de l'Univers, CEA, Université Paris-Saclay, Gif-sur-Yvette, France; R. Brent Tully, Institute for Astronomy (IfA), University of Hawaii, USA; and Hélène M. Courtois, University of Lyon 1, France.

The work appears in the August 10, 2017 issue of the Astrophysical Journal and can be found online here.

Credit: hawaii.edu

Cassini Sees Cloudy Waves on Saturn

Cassini Sees Cloudy Waves on Saturn:


Credit: NASA/JPL-Caltech/Space Science Institute


Clouds on Saturn take on the appearance of strokes from a cosmic brush thanks to the wavy way that fluids interact in Saturn's atmosphere. Neighboring bands of clouds move at different speeds and directions depending on their latitudes. This generates turbulence where bands meet and leads to the wavy structure along the interfaces. Saturn’s upper atmosphere generates the faint haze seen along the limb of the planet in this image.

This false color view is centered on 46 degrees north latitude on Saturn. The images were taken with the Cassini spacecraft narrow-angle camera on May 18, 2017 using a combination of spectral filters which preferentially admit wavelengths of near-infrared light. The image filter centered at 727 nanometers was used for red in this image; the filter centered at 750 nanometers was used for blue. (The green color channel was simulated using an average of the two filters.)

The view was obtained at a distance of approximately 750,000 miles (1.2 million kilometers) from Saturn. Image scale is about 4 miles (7 kilometers) per pixel.

The Cassini mission is a cooperative project of NASA, ESA (the European Space Agency) and the Italian Space Agency. The Jet Propulsion Laboratory, a division of the California Institute of Technology in Pasadena, manages the mission for NASA's Science Mission Directorate, Washington. The Cassini orbiter and its two onboard cameras were designed, developed and assembled at JPL. The imaging operations center is based at the Space Science Institute in Boulder, Colorado.

Credit: NASA