Friday, August 15, 2014

Perigee “Super” Moon Images from Around the World

Perigee “Super” Moon Images from Around the World:


The supermoon of August 10, 2014 rising behind Mt. Rundle and Banff, Alberta, Canada as shot from the Mt. Norquay viewpoint looking south over the valley. Credit and copyright: Alan Dyer.

The supermoon of August 10, 2014 rising behind Mt. Rundle and Banff, Alberta, Canada as shot from the Mt. Norquay viewpoint looking south over the valley. Credit and copyright: Alan Dyer.
Wow! The astrophotographers out there are getting artsy! Take a look at some of the most artistic images of the full Moon we’ve seen yet. The August 10 full Moon was a so-called “super” Moon — and it was the “super-est” of a trio of full Moons being at perigee, or its closest approach to the Earth in its orbit. It was just 356,896 kilometers distant at 17:44 UTC, less than an hour from Full. You can see a comparison shot of the perigee and apogee Moons this year immediately below. Find all the technical details here, but enjoy a gallery of great images from around the world


A comparison the between two 'extreme' full Moons of 2014:  the perigee Full Moon of August 10th, and the apogee full Moon of January 16. As seen from Central Italy. Credit and copyright: Giuseppe Petricca.

A comparison the between two ‘extreme’ full Moons of 2014: the perigee Full Moon of August 10th, and the apogee full Moon of January 16. As seen from Central Italy. Credit and copyright: Giuseppe Petricca.
The August 10, 2014 'super' Moon. Credit and copyright: Robbie Ambrose.

The August 10, 2014 ‘super’ Moon. Credit and copyright: Robbie Ambrose.
Supermoon timelapse composite on August 10 near the ship mast at Barnegat Light on Long Beach Island, New Jersey. Credit and copyright: FrankM301 on Flickr.

Supermoon timelapse composite on August 10 near the ship mast at Barnegat Light on Long Beach Island, New Jersey. Credit and copyright: FrankM301 on Flickr.
A cloudy look at the perigee Moon of August 10, 2014 along side the Desde el Obelisco, Malecón de Santo Domingo, Dominican Republic. Credit and copyright: Goku Abreu.

A cloudy look at the perigee Moon of August 10, 2014 along side the Desde el Obelisco, Malecón de Santo Domingo, Dominican Republic. Credit and copyright: Goku Abreu.
'Super' Moon, August 10, 2014, taken with Nikon D80 from Ottawa, Canada. Credit and copyright: Andrew Symes.

‘Super’ Moon, August 10, 2014, taken with Nikon D80 from Ottawa, Canada. Credit and copyright: Andrew Symes.
Super Moon (and a companion) rising over Brixton, South London. 10/08/2014. Credit and copyright: Owen Llewellyn.

Super Moon (and a companion) rising over Brixton, South London. 10/08/2014. Credit and copyright: Owen Llewellyn.
Camaro and Full Moon - Aug 9, 2014. Taken from the Cairns Wharf in Australia at dusk using an iPhone 5. Three frames; two exposures each. Credit and copyright: Joseph Brimacombe.

Camaro and Full Moon – Aug 9, 2014.Taken from the Cairns Wharf in Australia at dusk using an iPhone 5. Three frames; two exposures each. Credit and copyright: Joseph Brimacombe.
It was prom night in Cairns… so the fancy cars were out. See Joseph’s other “prom supermoon” image here.

People watch the nearly 'super' Moon rise on August 9, 2014 near a lighthouse.  Credit and copyright:  Will Nourse.

People watch the nearly ‘super’ Moon rise on August 9, 2014 near a lighthouse. Credit and copyright: Will Nourse.
Perigee Full Moon mosaic from August 10, 2014 (a first attempt at a mosaic!) Credit and copyright: Mary Spicer.

Perigee Full Moon mosaic from August 10, 2014 (a first attempt at a mosaic!) Credit and copyright: Mary Spicer.
Perigee Moon rise over London on August 10, 2014. Credit and copyright: Sculptor Lil.

Perigee Moon rise over London on August 10, 2014. Credit and copyright: Sculptor Lil.
The perigee Moon from Toronto, Canada at 8:35 pm EDT. Credit and copyright: Rick Ellis.

The perigee Moon from Toronto, Canada at 8:35 pm EDT. Credit and copyright: Rick Ellis.
A full Moon flyby, as seen from Paris, France. Credit and copyright: Sebastien Lebrigand.

A full Moon flyby, as seen from Paris, France. Credit and copyright: Sebastien Lebrigand.
Want to get your astrophoto featured on Universe Today? Join our Flickr group or send us your images by email (this means you’re giving us permission to post them). Please explain what’s in the picture, when you took it, the equipment you used, etc.

Tagged as:
Astrophotos,
full moon,
Moon,
Observing,
perigee moon,
Supermoon,
supermoon 2014

How did Supermassive Black Holes Grow so Massive so Quickly?

How did Supermassive Black Holes Grow so Massive so Quickly?:


Artist concept of matter swirling around a black hole. (NASA/Dana Berry/SkyWorks Digital)

An artist’s conception of a swirling accretion disk around a black hole. Credit: NASA / Dana Berry / SkyWorks Digital
Black holes one billion times the Sun’s mass or more lie at the heart of many galaxies, driving their evolution. Although common today, evidence of supermassive black holes existing since the infancy of the Universe, one billion years or so after the Big Bang, has puzzled astronomers for years.

How could these giants have grown so massive in the relatively short amount of time they had to form? A new study led by Tal Alexander from the Weizmann Institute of Science and Priyamvada Natarajn from Yale University, may provide a solution.

Black holes are often mistaken to be monstrous creatures that suck in dust and gas at an enormous rate. But this couldn’t be further from the truth (in fact the words “suck” and “black hole” in the same sentence makes me cringe). Although they typically accumulate bright accretion disks — swirling disks of gas and dust that make them visible across the observable Universe — these very disks actually limit the speed of growth.

First, any infalling matter can only enter through the accretion disk. Second, as matter in an accretion disk gets close to the black hole, traffic jams occur that slow down any other infalling material. And third, as matter collides within these traffic jams, it heats up, generating energy radiation that actually drives gas and dust away from the black hole.

A star or a gas stream can actually be on a stable orbit around the black hole, much as a planet orbits around a star. So it is quite a challenge for astronomers to think of ways that would make a black hole grow to supermassive proportions.

Luckily, Alexander and Natarajan may have found a way to do this: by placing the black hole within a cluster of thousands of stars, they’re able to operate without the restrictions of an accretion disk.

Black holes are generally thought to form when massive stars, weighing tens of solar masses, explode after their nuclear fuel is spent. Without the nuclear furnace at its core pushing against gravity, the star collapses. While the inner layers fall inward to form a black hole of only about 10 solar masses, the outer layers fall faster, hitting the inner layers, and rebounding in a huge supernova explosion. At least that’s the simple version.

 A small black hole gains mass: Dense cold gas (green) flows toward the center of a stellar cluster (red cross in blue circle) with stars (yellow); the erratic path of the black hole through the gas (black line) is randomized by the surrounding stars Prof. Tal Alexander’s research is supported by the European Research Council.

The erratic path of the black hole through the gas (black line) is randomized by the surrounding stars (yellow circles). Meanwhile, dense cold gas (green arrows) flows toward the center of the cluster (red cross). Credit: Weizmann Institute of Science.
The team began with a model of a black hole, created from this stellar blast, embedded within a cluster of thousands of stars. A continuous flow of dense, cold, opaque gas fell into the black hole. But here’s the trick: the gravitational pull of many nearby stars caused it to zigzag randomly, preventing it from forming an accretion disk.

Without an accretion disk, not only is matter able to fall into the black hole from all sides, but it isn’t slowed down in the accretion disk itself.

All in all, the model suggests that a black hole 10 times the mass of the Sun could grow to more than 10 billion times the mass of the Sun by one billion years after the Big Bang.

The paper was published Aug. 7 in Science and is available online.

Tagged as:
Black Holes,
Cosmology,
Early Universe,
quasars

Some Of Comet ISON’s Organic Materials Arose In An Unexpected Place

Some Of Comet ISON’s Organic Materials Arose In An Unexpected Place:


While Comet ISON’s breakup around Thanksgiving last year disappointed many amateur observers, its flight through the inner solar system beforehand showed scientists something neat: it was carrying organic materials with it.

A group examined the molecules surrounding the comet in its coma (atmosphere) and, along with observations of Comet Lemmon, created a 3-D model that you can see above. Among other results, this revealed the presence of formaldehyde and HNC (hydrogen, nitrogen and carbon). The formaldehyde was expected, but the spot where HNC was found came as a surprise.

Scientists used to think that HNC is produced from the nucleus, but the research revealed that it actually happens when larger molecules or organic dust breaks down in the coma.

“Understanding organic dust is important, because such materials are more resistant to destruction during atmospheric entry, and some could have been delivered intact to early Earth, thereby fueling the emergence of life,” stated Michael Mumma, a co-author on the study who is director of the Goddard Center for Astrobiology. “These observations open a new window on this poorly known component of cometary organics.”

Comet ISON was one of the two comets studied by scientists using the Atacama Large Millimeter/submillimeter Array (ALMA). The diagram shows where it was located in the solar system at the time of observations. 3-D images of its coma (atmosphere) revealed organic compounds. Credit: B. Saxton (NRAO/AUI/NSF); NASA/ESA Hubble; M. Cordiner, NASA, et al.

Comet ISON was one of the two comets studied by scientists using the Atacama Large Millimeter/submillimeter Array (ALMA). The diagram shows where it was located in the solar system at the time of observations. 3-D images of its coma (atmosphere) revealed organic compounds. Credit: B. Saxton (NRAO/AUI/NSF); NASA/ESA Hubble; M. Cordiner, NASA, et al.
Observation were made possible using the powerful Atacama Large Millimeter/submillimeter Array (ALMA). The array of 66 radio telescopes in Chile allows astronomers to map molecules and peer past dust clouds in star systems under formation, among other things. ALMA was completed last year and is the largest telescope of its type in the world.

The array’s resolution allowed scientists to probe for these molecules in moderately bright comets, which is also new. Previously, these types of studies were limited to “blockbuster” visitors such as Comet Hale-Bopp in the 1990s, NASA sated.

The study, which was led by the Goddard Center for Astrobiology’s Martin Cordiner at NASA’s Goddard Space Flight Center, was published in Astrophysical Journal Letters. The research is also available in preprint version on Arxiv.

Source: NASA

Tagged as:
ALMA,
Atacama Large Millimeter/submillimeter Array,
organic materials

Awesome Video of a Satellite in Orbit

Awesome Video of a Satellite in Orbit:


Here’s a great video from a camera mounted on the exterior of the TechDemoSat-1, an in-orbit technology demonstration mission from the UK. It launched on July 8, 2014 on a Soyuz-2, and the video shows the satellite moments after separation from the upper stage. The satellite even took a selfie, below.

The video shows the satellite’s rotation and reveals a spectacular vista of “blue marble” Earth (visible is cloudy skies over the Pacific, south of French Polynesia).

It’s interesting to note that some identified flying objects zip past the field of view: At :25 seconds, the Fregat upper stage of the Soyuz-2 rocket appears as a gold object passing away from the satellite left to right at a distance of approximately 60 meters. At :34 seconds a white “dot” crosses the frame left to right – which has been identified as one of the other satellites that shared the ride into orbit with TechDemoSat-1.


Image of the TechDemoSat-1 in orbit, taken minutes after separation of the satellite from the Soyuz-2 launcher and shows a view of the Earth from Space, with the spacecraft's Antenna Pointing Mechanism in view. Credit: SSTL.

Image of the TechDemoSat-1 in orbit, taken minutes after separation of the satellite from the Soyuz-2 launcher and shows a view of the Earth from Space, with the spacecraft’s Antenna Pointing Mechanism in view. Credit: SSTL.
“It is very rare to see actual footage of our satellites in orbit,” said Sir Martin Sweeting, Executive Chairman of Surrey Satellite Technology Ltd (SSTL), the company behind the mission, “and so viewing the video taken from TechDemoSat-1 moments after separation from the rocket has been a hugely rewarding and exciting experience for everyone at SSTL. We are delighted with the progress of commissioning the TechDemoSat-1 platform, and are looking forward to the next phase – the demonstration of a range of new technologies being flown on this innovative mission.”

The satellite is roughly the size of a refrigerator but wieghs just 150kg. TechDemoSat (TDS-1) carries eight separate payloads from UK academia and industry plus other payloads from SSTL for product development. Find out more here from SSTL.

Tagged as:
launches,
Satellites,
TechDemoSat-1,
Videos

Can Radio Waves Lead to Exomoons?

Can Radio Waves Lead to Exomoons?:

An artist's conception of a distance exomoon blocking out a star's light. Credit: Dan

An artist’s conception of a distant exomoon blocking out a star’s light. Credit: Dan Durda
I firmly believe that our next greatest discovery will be detecting an exomoon in orbit around a distant exoplanet. Although no one has been able to confirm an exomoon — yet — the hunt is on.

Now, a research team thinks following a trail of radio wave emissions may lead astronomers to this groundbreaking discovery.


NASA’s Carbon Dioxide Greenhouse Gas Observatory Captures ‘First Light’ at Head of International ‘A-Train’ of Earth Science Satellites

NASA’s Carbon Dioxide Greenhouse Gas Observatory Captures ‘First Light’ at Head of International ‘A-Train’ of Earth Science Satellites:


OCO-2 leads the international Afternoon Constellation, or A-Train, of Earth-observing satellites as shown in this artist's concept.  Japan’s Global Change Observation Mission - Water (GCOM-W1) satellite and NASA’s Aqua, CALIPSO, CloudSat and Aura satellites follow.   Credit:  NASA

OCO-2 leads the international Afternoon Constellation, or A-Train, of Earth-observing satellites as shown in this artist’s concept. Japan’s Global Change Observation Mission – Water (GCOM-W1) satellite and NASA’s Aqua, CALIPSO, CloudSat and Aura satellites follow. Credit: NASA
NASA’s first spacecraft dedicated to studying Earth’s atmospheric carbon dioxide (CO2) levels and carbon cycle has reached its final observing orbit and taken its first science measurements as the leader of the world’s first constellation of Earth science satellites known as the International “A-Train.”

The Orbiting Carbon Observatory-2 (OCO-2) is a research satellite tasked with collecting the first global measurements of atmospheric carbon dioxide (CO2) – the leading human-produced greenhouse gas and the principal human-produced driver of climate change.

The ‘first light’ measurements were conducted on Aug. 6 as the observatory flew over central Papua New Guinea and confirmed the health of the science instrument. See graphic below.

NASA's OCO-2 spacecraft collected "first light” data Aug. 6 over New Guinea. OCO-2’s spectrometers recorded the bar code-like spectra, or chemical signatures, of molecular oxygen or carbon dioxide in the atmosphere. The backdrop is a simulation of carbon dioxide created from GEOS-5 model data.  Credit:  NASA/JPL-Caltech/NASA GSFC

NASA’s OCO-2 spacecraft collected “first light” data Aug. 6 over New Guinea. OCO-2’s spectrometers recorded the bar code-like spectra, or chemical signatures, of molecular oxygen or carbon dioxide in the atmosphere. The backdrop is a simulation of carbon dioxide created from GEOS-5 model data. Credit:
NASA/JPL-Caltech/NASA GSFC
Before the measurements could begin, mission controllers had to cool the observatory’s three-spectrometer instrument to its operating temperatures.

“The spectrometer’s optical components must be cooled to near 21 degrees Fahrenheit (minus 6 degrees Celsius) to bring them into focus and limit the amount of heat they radiate. The instrument’s detectors must be even cooler, near minus 243 degrees Fahrenheit (minus 153 degrees Celsius), to maximize their sensitivity,” according to a NASA statement.

The team still has to complete a significant amount of calibration work before the observatory is declared fully operational.


OCO-2 was launched
just over a month ago during a spectacular nighttime blastoff on July 2, 2014, from Vandenberg Air Force Base, California, atop a the venerable United Launch Alliance Delta II rocket.

OCO-2 arrived at its final 438-mile (705-kilometer) altitude, near-polar orbit on Aug. 3 at the head of the international A-Train following a series of propulsive burns during July. Engineers also performed a thorough checkout of all of OCO-2’s systems to ensure they were functioning properly.

“The initial data from OCO-2 appear exactly as expected — the spectral lines are well resolved, sharp and deep,” said OCO-2 chief architect and calibration lead Randy Pollock of JPL, in a statement.

“We still have a lot of work to do to go from having a working instrument to having a well-calibrated and scientifically useful instrument, but this was an important milestone on this journey.”

Artist's rendering of NASA's Orbiting Carbon Observatory (OCO)-2, one of five new NASA Earth science missions set to launch in 2014, and one of three managed by JPL. Credit:  NASA-JPL/Caltech

Artist’s rendering of NASA’s Orbiting Carbon Observatory (OCO)-2, one of five new NASA Earth science missions set to launch in 2014, and one of three managed by JPL. Credit: NASA-JPL/Caltech
OCO-2 now leads the A-Train constellation, comprising five other international Earth orbiting monitoring satellites that constitute the world’s first formation-flying “super observatory” that collects an unprecedented quantity of nearly simultaneous climate and weather measurements.

Scientists will use the huge quantities of data to record the health of Earth’s atmosphere and surface environment as never before possible.

OCO-2 is followed in orbit by the Japanese GCOM-W1 satellite, and then by NASA’s Aqua, CALIPSO, CloudSat and Aura spacecraft, respectively. All six satellites fly over the same point on Earth within 16 minutes of each other. OCO-2 currently crosses the equator at 1:36 p.m. local time.

The 999 pound (454 kilogram) observatory is the size of a phone booth.

OCO-2 is equipped with a single science instrument consisting of three high-resolution, near-infrared spec¬trometers fed by a common telescope. It will collect global measurements of atmospheric CO2 to provide scientists with a better idea of how CO2 impacts climate change and is responsible for Earth’s warming.

During a minimum two-year mission the $467.7 million OCO-2 will take near global measurements to locate the sources and storage places, or ‘sinks’, for atmospheric carbon dioxide, which is a critical component of the planet’s carbon cycle.


Tagged as:
A-Train,
Delta II rocket,
Earth observing satellites,
JPL,
NASA,
oco-2,
Orbital Sciences Corporation,
orbiting carbon observatory-2,
Vandenberg Air Force Base

A Spectacular Dawn Conjunction of Venus and Jupiter Set For August 18th

A Spectacular Dawn Conjunction of Venus and Jupiter Set For August 18th:


The last dawn pairing of Venus, Jupiter and the crescent Moon in the dawn sky in 2012... this month's will be much tighter! Credit: Tavi Greiner.

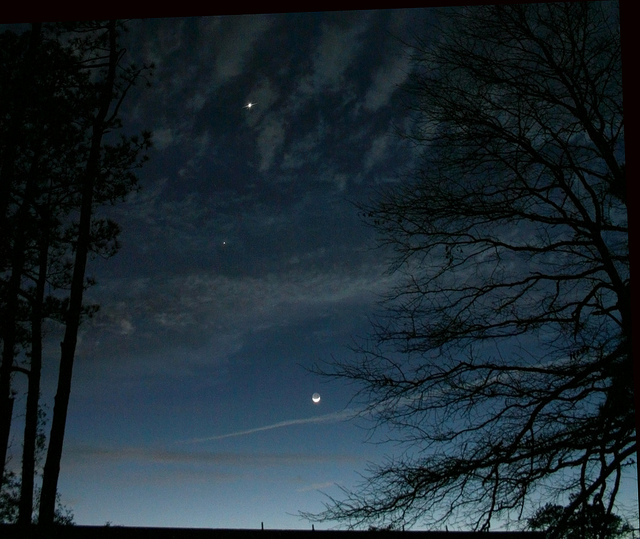
A grouping of the planets Venus, Jupiter and the crescent Moon in the dawn sky in 2012… this month’s conjunction will be much tighter! Credit: Tavi Greiner.
“What are those two bright stars in the morning sky?”

About once a year we can be assured that we’ll start fielding inquires to this effect, as the third and fourth brightest natural objects in the sky once again meet up.

We’re talking about a conjunction of the planets Jupiter and Venus. Venus has been dominating the dawn sky for 2014, and Jupiter is fresh off of solar conjunction on the far side of the Sun on July 24th and is currently racing up to greet it.

We just caught sight of Jupiter for the first time for this apparition yesterday from our campsite on F.E. Warren Air Force Base in Cheyenne, Wyoming. We’d just wrapped up an early vigil for Perseid meteors and scrambled to shoot a 
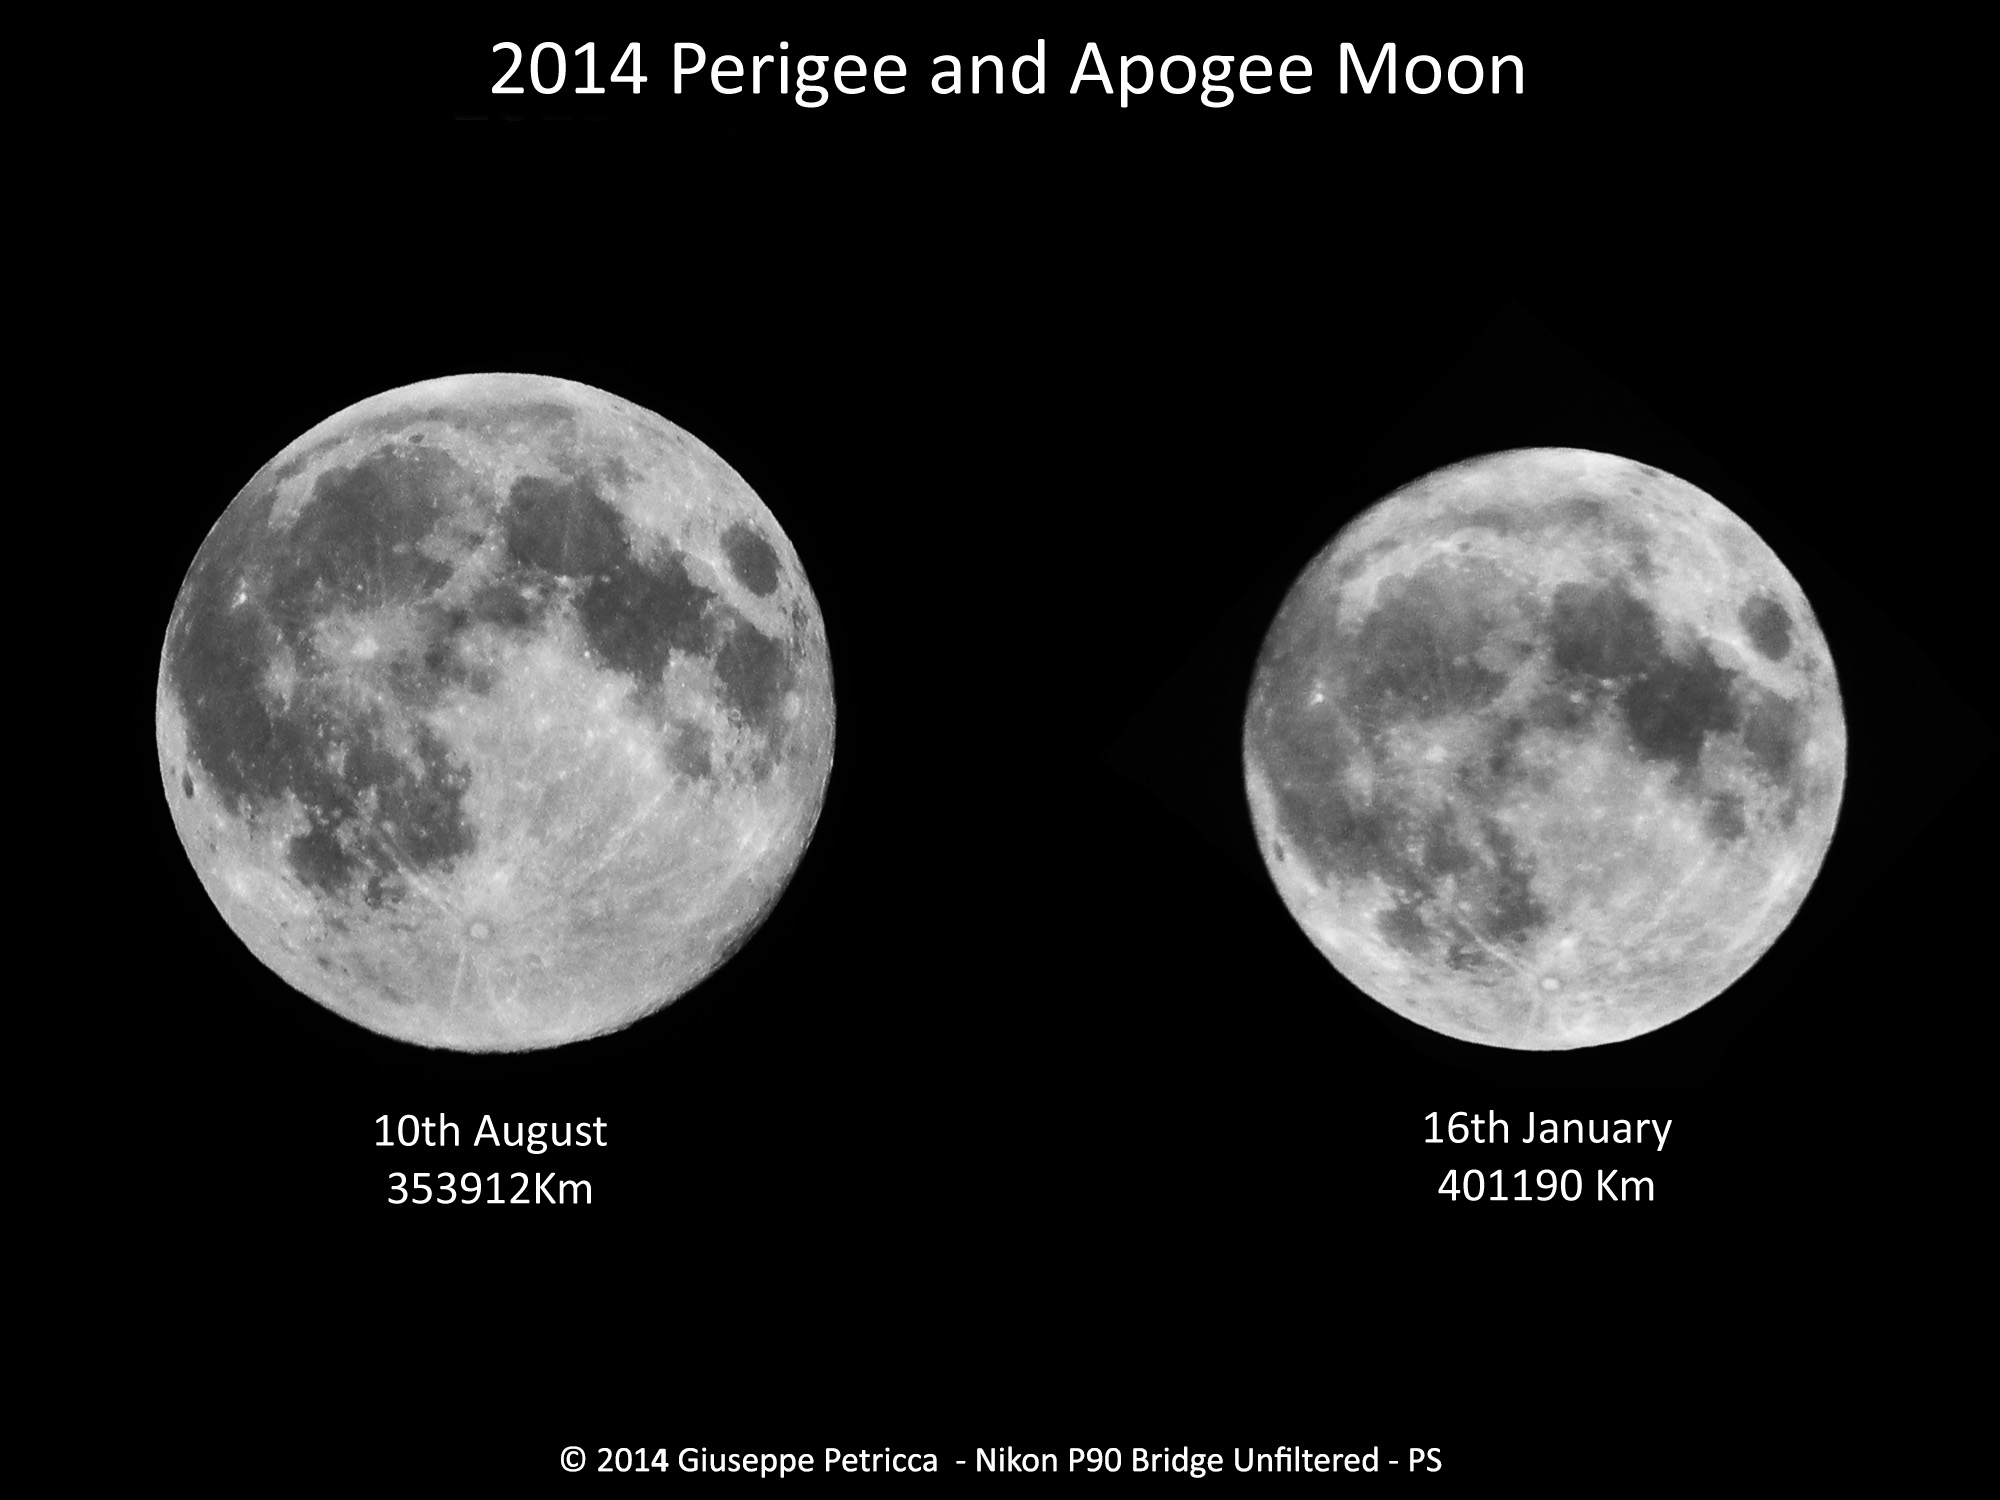
quick sequence of the supermoon setting behind a distant wind farm. Jupiter was an easy catch, first with binoculars, and then the naked eye, using brilliant Venus as a guide post.

Stellarium

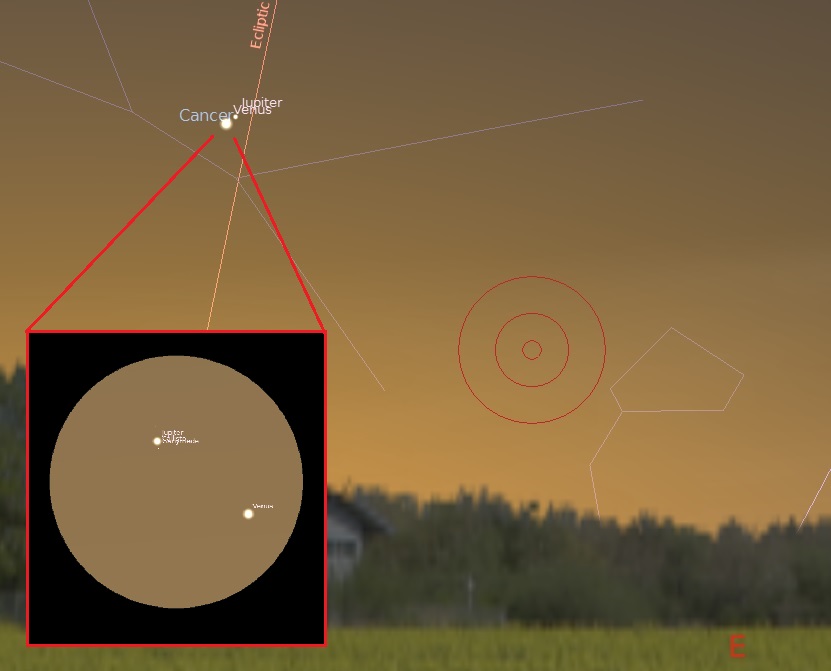
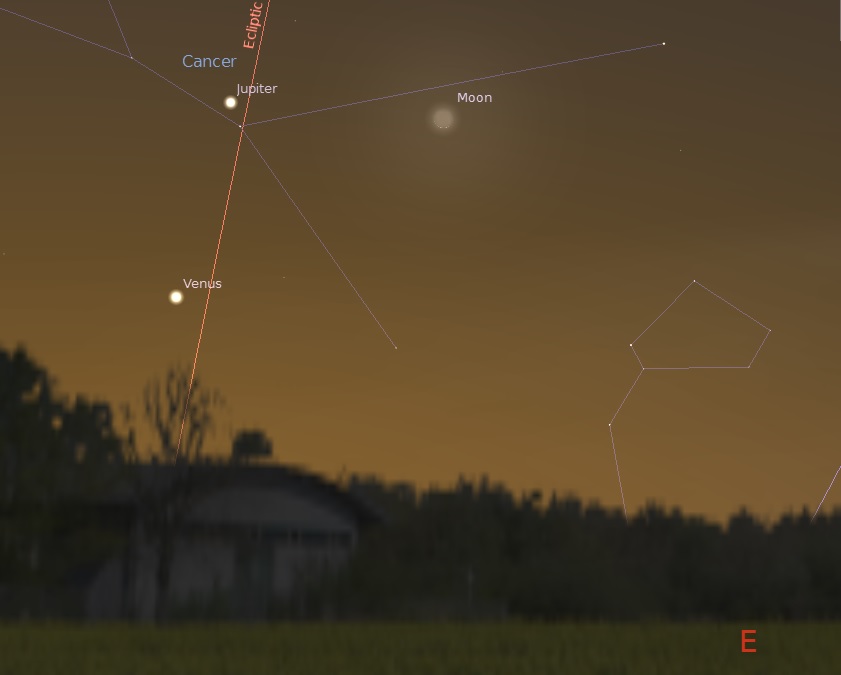
The view looking eastward at dawn on August 18th, including a five degree telrad (red circles) and a one degree telescopic field of view (inset). Created using Stellarium.
And Jupiter will become more prominent as the week progresses, climaxing with a fine conjunction of the pair on Monday, August 18
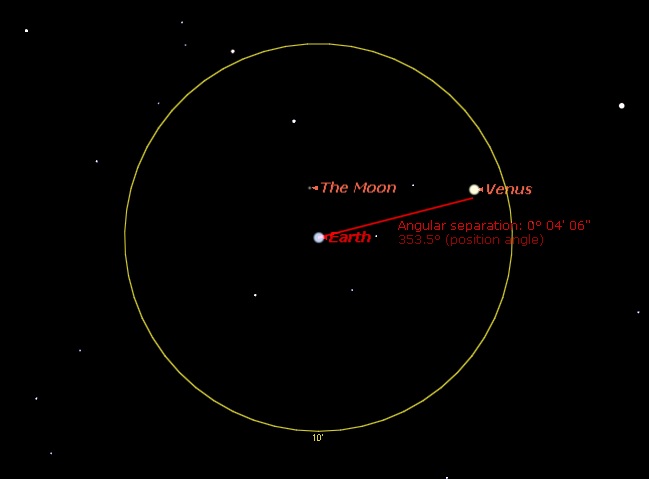
th. This will be the closest planet versus planet conjunction for 2014. At their closest — around 4:00 Universal Time or midnight Eastern Daylight Saving Time — Venus and Jupiter will stand only 11.9’ apart, less than half the diameter of a Full Moon. This will make the pair an “easy squeeze” into the same telescopic field of view at low power. Venus will shine at magnitude -3.9, while Jupiter is currently about 2 magnitudes or 6.3 times fainter at magnitude -1.8. In fact, Jupiter shines about as bright as another famous star just emerging into the dawn sky, Sirius. Such a dawn sighting is known as a heliacal rising, and the first recovery of Sirius in the dawn heralded the flooding of the Nile for the ancient Egyptians and the start what we now term the Dog Days of Summer.

To the naked eye, enormous Jupiter will appear to be the “moon” that Venus never had next weekend. The spurious and legendary Neith reported by astronomers of yore lives! You can imagine the view of the Earth and our large Moon as a would-be Venusian astronomer stares back at us (you’d have to get up above those sulfuric acid clouds, of course!)

Said conjunction is only a product of our Earthly vantage point. Venus currently exhibits a waxing gibbous disk 10” across — three times smaller than Jupiter — but Venus is also four times closer to Earth at 1.61 astronomical units distant. And from Jupiter’s vantage point, you’d see a splendid conjunction of Venus and the Earth, albeit only three degrees from the Sun:

conjunction

Earth meets Venus, as seen from Jupiter on August 18th. Note the Moon nearby. Created using Starry Night Education Software.
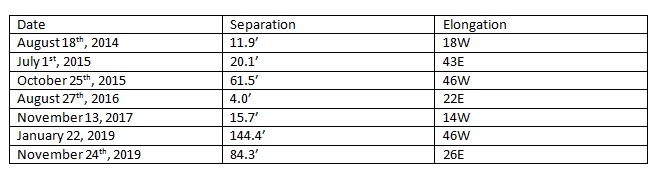
How often do the two brightest planets in the sky meet up? Well, Jupiter reaches the same solar longitude (say, returns back to opposition again) about once every 13 months. Venus, however, never strays more than 47.1 degrees elongation from the Sun and can thus always be found in either the dawn or dusk sky. This means that Jupiter pairs up with Venus roughly about once a year:

A list

A list of Venus and Jupiter conjunctions, including angular separation and elongations (west=dawn, east=dusk) from now until 2020. Created by author.
Note that next year and 2019 offer up two pairings of Jupiter and Venus, while 2018 lacks even one. And the conjunction on August 27th, 2016 is only 4’ apart! And yes, Venus can indeed occult Jupiter, although that hasn’t happened since 1818 and won’t be seen again from Earth until – mark your calendars – November 22nd, 2065, though only a scant eight degrees from the Sun. Hey, maybe SOHO’s solar observing successor will be on duty by then…

Venus has been the culprit in many UFO sightings, as pilots have been known to chase after it and air traffic controllers have made furtive attempts to hail it over the years. And astronomy can indeed save lives when it comes to conjunctions: in fact, last year’s close pairing of Jupiter and Venus in the dusk sky nearly sparked an international incident, when Indian Army sentries along the Himalayan border with China mistook the pair for Chinese spy drones. Luckily, Indian astronomers identified the conjunction before shots were exchanged!

Earth strikes back...

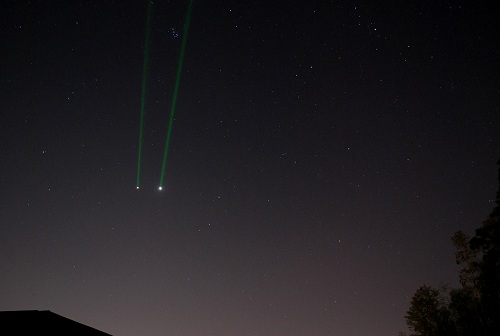
Earth strikes back… firing a 5mw green laser at the 2013 conjunction of Jupiter and Venus. Photo by author.
Next week’s conjunction also occurs against the backdrop of Messier 44/Praesepe, also known as the “Beehive cluster”. It’ll be difficult to catch sight of M44, however, because the entire “tri-conjunction” sits only 18 degrees from the Sun in the dawn sky. Binocs or a low power field of view might tease out the distant cluster from behind the planetary pair.

And to top it off, the waning crescent Moon joins the group on the mornings of August 23rd and 24th, passing about five degrees distant. Photo op! Can you follow Venus up into the daytime sky, using the Moon as a guide? How about Jupiter? Be sure to block that blinding Sun behind a hill or building while making this attempt.

Stellarium

The Moon photobombs the conjunction of Venus and Jupiter on the weekend of August 23rd. Credit: Stellarium.
The addition of the Moon will provide the opportunity to catch a skewed “emoticon” conjunction. A rare smiley face “:)” conjunction occurred in 2009, and another tight skewed tri-conjunction is in the offering for 2056. While many national flags incorporate examples of close pairings of Venus and the crescent Moon, we feel at least one should include a “smiley face” conjunction, if for no other reason than to highlight the irony of the cosmos.

A challenge: can you catch a time exposure of the International Space Station passing Venus and Jupiter? You might at least pull off a “:/” emoticon image!

Don’t miss the astronomical action unfolding in a dawn sky near you over the coming weeks. And be sure to spread the word: astronomical knowledge may just well avert a global catastrophe. The fate of the free world lies in the hands of amateur astronomers!

Tagged as:
2014 astronomy,
august astronomy,
conjunction,
perseid meteors,
Supermoon,
venus jupiter conjunction

Earth Nightlights (and Nightlife!) Shine In Stellar Shots From Space Station

Earth Nightlights (and Nightlife!) Shine In Stellar Shots From Space Station:


A Soyuz spacecraft on the International Space Station (front) above the lights of Europe. Picture taken during Expedition 40. Credit: Reid Wiseman/Twitter

A Soyuz spacecraft on the International Space Station (front) above the lights of Europe. Picture taken during Expedition 40. Credit: Reid Wiseman/Twitter
A lot of action happens on Earth at night! Just ask NASA’s Reid Wiseman, a prolific picture-tweeter who recently uploaded a series of images of night lights shining all around the world.

From his perch on the International Space Station, Wiseman sent pictures showing borders from space, that glowing punch in the desert landscape that is Dubai, and clouds rolling in over the bright lights of Los Angeles. Check out some samples below the jump.

The North Arabian Sea on Saturday evening. pic.twitter.com/OrAkGxHRJL

— Reid Wiseman (@astro_reid) August 12, 2014
You can absolutely see #borders from space. Seoul, Korea and a line just north. pic.twitter.com/ORQ72XEHdT

— Reid Wiseman (@astro_reid) August 12, 2014
You can absolutely see #borders from space. Here, a bright yellow line divides San Diego and Tijuana. pic.twitter.com/NwqcU3L1cB

— Reid Wiseman (@astro_reid) August 12, 2014
I love how the clouds encroach on #LA Saturday night pic.twitter.com/Lz3Y1ov80g

— Reid Wiseman (@astro_reid) August 12, 2014
#Beijing pic.twitter.com/bO7OvaaOwk

— Reid Wiseman (@astro_reid) August 12, 2014
Wow!!! San Diego, LA, San Francisco. And Vegas sticks out a bit in the desert! pic.twitter.com/yRP2T8U1zD

— Reid Wiseman (@astro_reid) August 12, 2014
#Dubai shines bright on a super clear night. pic.twitter.com/YkMoMArhZk

— Reid Wiseman (@astro_reid) August 11, 2014
Florida and Cuba under the #supermoon this past Saturday morning. pic.twitter.com/zWJmVLpH9b

— Reid Wiseman (@astro_reid) August 11, 2014
Tagged as:
expedition 40,
reid wiseman

NASA’S NuSTAR Catches a Black Hole Bending Light, Space, and Time

NASA’S NuSTAR Catches a Black Hole Bending Light, Space, and Time:


This plot of data captured by NASA's Nuclear Spectroscopic Telescope Array, or NuSTAR, shows X-ray light streaming from regions near a supermassive black hole known as Markarian 335. Credit: NASA

This plot of data captured by NASA’s Nuclear Spectroscopic Telescope Array, or NuSTAR, shows X-ray light streaming from regions near a supermassive black hole known as Markarian 335. Credit: NASA
NASA’s Nuclear Spectroscopic Telescope Array (NuSTAR) has captured a spectacular event: a supermassive black hole’s gravity tugging on nearby X-ray light.

In just a matter of days, the corona — a cloud of particles traveling near the speed of light — fell in toward the black hole. The observations are a powerful test of Einstein’s theory of general relativity, which says gravity can bend space-time, the fabric that shapes our universe, and the light that travels through it.

“The corona recently collapsed in toward the black hole, with the result that the black hole’s intense gravity pulled all the light down onto its surrounding disk, where material is spiraling inward,” said coauthor Michael Parker from the Institute of Astronomy in Cambridge, United Kingdom, in a press release.

The supermassive black hole, known as Markarian 335, is about 324 million light-years from Earth in the direction of the constellation Pegasus. Such an extreme system squeezes about 10 million times the mass of our Sun into a region only 30 times the diameter of the Sun. It spins so rapidly that space and time are dragged around with it.

NASA’s Swift satellite has monitored Mrk 335 for years, recently noting a dramatic change in its X-ray brightness. So NuSTAR was redirected to take a second look at the system.

NuSTAR has been collecting X-rays from black holes and dying stars for the past two years. Its specialty is analyzing high-energy X-rays in the range of 3 to 79 kiloelectron volts. Observations in lower-energy X-ray light show a black hole obscured by clouds of gas and dust. But NuSTAR can take a detailed look at what’s happening near the event horizon, the region around a black hole form which light can no longer escape gravity’s grasp.

Specifically, NuSTAR is able to see the corona’s direct light, and its reflected light off the accretion disk. But in this case, the light is blurred due to the combination of a few factors. First, the doppler shift is affecting the spinning disk. On the side spinning away from us, the light is shifted to redder wavelengths (and therefore lower energy), whereas on the side spinning toward us, the light is shifted to bluer wavelengths (and therefore higher energy). A second effect has to do with the enormous speeds of the spinning black hole. And a final effect is from the gravity of the black hole, which pulls on the light, causing it to lose energy.

All of these factors cause the light to smear.

Intriguingly, NuSTAR observations also revealed that the grip of the black hole’s gravity pulled the corona’s light onto the inner portion of the accretion disk, better illuminating it. NASA explains that as if somebody had shone a flashlight for the astronomers, the shifting corona lit up the precise region they wanted to study.

“We still don’t understand exactly how the corona is produced or why it changes its shape, but we see it lighting up material around the black hole, enabling us to study the regions so close in that effects described by Einstein’s theory of general relativity become prominent,” said NuSTAR Principal Investigator Fiona Harrison of the California Institute of Technology. “NuSTAR’s unprecedented capability for observing this and similar events allows us to study the most extreme light-bending effects of general relativity.”

The new data will likely shed light on these mysterious coronas, where the laws of physics are pushed to their limit.

The article has been published in the Monthly Notices of the Royal Astronomical Society and is available online.

Tagged as:
Einstein's Theory of General Relativity,
supermassive black holes

Diamond Pinpricks: Gorgeous Shot Of Star Group That Once Baffled Astronomers

Diamond Pinpricks: Gorgeous Shot Of Star Group That Once Baffled Astronomers:


A Hubble Space Telecope picture of globular cluster IC 4499. The new observations showed that it is about 12 billion years old, contrary to previous observations showing a puzzling young age. Credit: European Space Agency and NASA

A Hubble Space Telecope picture of globular cluster IC 4499. The new observations showed that it is about 12 billion years old, contrary to previous observations showing a puzzling young age. Credit: European Space Agency and NASA
Is this group of stars belonging to one generation, or more? That’s one of the things that was puzzling astronomers for decades, particularly when they were trying to pin down the age of IC 4499 — the globular cluster you see in this new picture from the Hubble Space Telescope.

While astronomers now know the stars are from a single generation that are about 12 billion years old (see this paper from three years ago), for about 15 years before that at least one paper said IC 4499 was three billion to four billion years younger than that.

“It has long been believed that all the stars within a globular cluster form at the about same time, a property which can be used to determine the cluster’s age,” stated information from the European Space Agency reposted on NASA’s website.

“For more massive globulars however, detailed observations have shown that this is not entirely true — there is evidence that they instead consist of multiple populations of stars born at different times.”

IC 4499 is somewhere in between these extremes, but only has a single generation of stars — its gravity wasn’t quite enough to pull in neighboring gas and dust to create more. Goes to show you how important it is to re-examine the results in science.

Source: NASA and the European Space Agency

Tagged as:
Globular Cluster,
ic 4499

Gravity Isn’t The Only Thing Holding Asteroids Together: Study

Gravity Isn’t The Only Thing Holding Asteroids Together: Study:


Rubble piles are common among asteroids, as illustrated by this artist's conception of 2011 MD. Credit: NASA/JPL-Caltech

Rubble piles are common among asteroids, as illustrated by this artist’s conception of 2011 MD. Credit: NASA/JPL-Caltech
How do asteroids hold their rubble piles together? Previously, scientists said it was a combination of friction and gravity. But new observations of asteroid 1950 DA reveals something else is at work. The asteroid is rotating too quickly for gravity to keep it together, so what’s going on?

“We found that 1950 DA is rotating faster than the breakup limit for its density,” stated Ben Rozitis, a postdoctoral researcher at the University of Tennessee, Knoxville who led the research. “So if just gravity were holding this rubble pile together, as is generally assumed, it would fly apart. Therefore, interparticle cohesive forces must be holding it together.”

Image of asteroid 1950 DA. Credit: NASA

Image of asteroid 1950 DA. Credit: NASA
Cohesive forces refer to the act of individual molecules or particles sticking together. It’s the first time scientists have found this in action on an asteroid. Better yet, if confirmed in other asteroids this has implications for protecting Earth from a killer asteroid should one come our way.

If the threat turns out to be a loosely held together asteroid, an impact in just the right spot would break the single asteroid into many. (Of course, you’d want to make sure that the problem doesn’t end up turning into multiple smaller asteroids hitting Earth instead of a single large one.)

Now the researchers are interested in knowing if cohesive forces are also in action on Comet 67P/Churyumov–Gerasimenko — the comet being examined by Rosetta right now and in November, by the lander Philae.

The study was published in the journal Nature.

Source: The University of Tennessee, Knoxville

Tagged as:
1950 da,
67P/Churyumov-Gerasimenko

How A Comet-Chasing Spacecraft ‘Likely’ Brought Interstellar Dust Back To Earth

How A Comet-Chasing Spacecraft ‘Likely’ Brought Interstellar Dust Back To Earth:


Artist's impression of the Stardust spacecraft. Credit: NASA/JPL-Caltech

Artist’s impression of the Stardust spacecraft. Credit: NASA/JPL-Caltech
If the scientists are right, a NASA spacecraft brought stuff from outside the solar system back to Earth. The Stardust spacecraft, which was originally tasked with chasing after Comet Wild 2, brought our planet seven grains that look fluffier than expected.

While the scientists say that more tests are needed to determine these particles originated from outside the solar system, they are confident enough to publish a paper on the findings today.

“They are very precious particles,” stated Andrew Westphal, a physicist at the University of California, Berkeley’s space sciences laboratory who led 65 co-authors who created a paper on the research.

What’s more, the findings came with a big assist from volunteers who participated in a crowdsourced project to look at dust tracks in Stardust’s aerogel detector.

The Stardust spacecraft was launched in February 1999 to gather samples of Comet Wild 2 and return them to our planet. Stardust also attempted to collect interstellar dust twice in 2000 and 2002 for 195 days. Its mission was extended in 2011 to look at Comet Tempel-1, the comet that Deep Impact crashed into.

The sample return capsule, however, separated from the spacecraft in January 2006 as planned while Stardust flew by our planet, landing safely on Earth. Comet samples and interstellar samples were stored separately. Scientists then began the work of seeing what the spacecraft had picked up.

An electron scanning microscope image of an interstellar dust impact on the Stardust spacecraft. The crater is 280 nanometers across. Residue from the dust particle is barely visible in the center. Credit: Rhonda Stroud, Naval Research Laboratory

An electron scanning microscope image of an interstellar dust impact on the Stardust spacecraft. The crater is 280 nanometers across. Residue from the dust particle is barely visible in the center. Credit: Rhonda Stroud, Naval Research Laboratory
Here’s where the volunteers came in. These people, who called themselves “Dusters”, participated in a project called Stardust@home that put more than a million images online for people to examine.

Three particles, dubbed “Orion”, “Hylabrook” and “Sorok”, were found in the aerogel detectors after volunteers discovered their tracks. (Many more tracks were discovered, but only a handful led to dust. Also, 100 tracks and about half of the 132 aerogel panels still need to be analyzed.)

Four more particles were tracked down in aluminum foils between the aerogel tiles. That wasn’t originally where they were supposed to be collectors, but despite their “splatted” and melted appearance there was enough left for scientists to analyze. (About 95% of the foils still need to be examined.)

One of the two largest specks found in the Stardust spacecraft that are suspected interstellar dust. This containned olivine, spinel, magnesium and iron. Credit: Westphal et al. 2014, Science/AAAS

One of the two largest specks found in the Stardust spacecraft that are suspected interstellar dust. This containned olivine, spinel, magnesium and iron. Credit: Westphal et al. 2014, Science/AAAS
So what did the scientists see? They describe the particles as fluffy, sometimes appearing to come from a mix of particles. The largest ones included crystalline material called olivine (a magnesium-iron-silicate). More testing is planned to see what their abundances of different types of oxygen are, which could help better understand where they came from.

Additionally, three of the foil particles had sulfur compounds, which is controversial because some astronomers believe that isn’t possible in interstellar dust particles.

The research was published in the journal Science. Twelve more papers on Stardust will be published in Meteoritics & Planetary Science.

Sources: University of California – Berkeley

Tagged as:
interstellar dust,
Stardust

Parallel Universes and the Many-Worlds Theory

Parallel Universes and the Many-Worlds Theory:


Credit: Glenn Loos-Austin

Credit: Glenn Loos-Austin
Are you unique? In your perception of the world, the answer is simple: you are different than every other person on this planet. But is our universe unique? The concept of multiple realities — or parallel universes — complicates this answer and challenges what we know about the world and ourselves. One model of potential multiple universes called the Many-Worlds Theory might sound so bizarre and unrealistic that it should be in science fiction movies and not in real life. However, there is no experiment that can irrefutably discredit its validity.

The origin of the parallel universe conjecture is closely connected with introduction of the idea of quantum mechanics in the early 1900s. Quantum mechanics, a branch of physics that studies the infinitesimal world, predicts the behavior of nanoscopic objects. Physicists had difficulties fitting a mathematical model to the behavior of quantum matter because some matter exhibited signs of both particle-like and wave-like movements. For example, the photon, a tiny bundle of light, can travel vertically up and down while moving horizontally forward or backward.

Such behavior starkly contrasts with that of objects visible to the naked eye; everything we see moves like either a wave or a particle. This theory of matter duality has been called the Heisenberg Uncertainty Principle (HUP), which states that the act of observation disturbs quantities like momentum and position.

In relation to quantum mechanics, this observer effect can impact the form – particle or wave – of quantum objects during measurements. Future quantum theories, like Niels Bohr’s Copenhagen interpretation, use HUP to state that an observed object does not retain its dual nature and can only behave in one state.

Multiverse Theory

Artist concept of the multiverse. Credit: Florida State University
In 1954, a young student at Princeton University named Hugh Everett proposed a radical supposition that differed from the popular models of quantum mechanics. Everett did not believe that observation causes quantum matter to stop behaving in multiple forms.

Instead, he argued that observation of quantum matter creates a split in the universe. In other words, the universe makes copies of itself to account for all the possibilities and these duplicates will proceed independently. Every time a photon is measured, for instance, a scientist in one universe will analyze it in wave form and the same scientist in another universe will analyze it in particle form. Each of these universes offers a unique and independent reality that coexists with other parallel universes.

If Everett’s Many-Worlds Theory (MWT) is true, it holds many ramifications that completely transform our perceptions on life. Any action that has more than one possible result produces a split in the universe. Thus, there are an infinite number of parallel universes and infinite copies of each person.

These copies have identical facial and body features, but do not have identical personalities (one may be aggressive and another may be passive) because each one experiences a separate outcome. The infinite number of alternate realities also suggests that nobody can achieve unique accomplishments. Every person – or some version of that person in a parallel universe – has done or will do everything.

Moreover, the MWT implies that everybody is immortal. Old age will no longer be a surefire killer, as some alternate realities could be so scientifically and technologically advanced that they have developed an anti-aging medicine. If you do die in one world, another version of you in another world will survive.

The most troubling implication of parallel universes is that your perception of the world is never real. Our “reality” at an exact moment in one parallel universe will be completely unlike that of another world; it is only a tiny figment of an infinite and absolute truth. You might believe you are reading this article at this instance, but there are many copies of you that are not reading. In fact, you are even the author of this article in some distant reality. Thus, do winning prizes and making decisions matter if we might lose those awards and make different choices? Is living important if we might actually be dead somewhere else?

Some scientists, like Austrian mathematician Hans Moravec, have tried to debunk the possibility of parallel universes. Moravec developed a famous experiment called quantum suicide in 1987 that connects a person to a fatal weapon and a machine that determines the spin value, or angular momentum, of protons. Every 10 seconds, the spin value, or quark, of a new proton is recorded.

Based on this measurement, the machine will cause the weapon to kill or spare the person with a 50 percent chance for each scenario. If the Many-World’s Theory is not true, then the experimenter’s survival probability decreases after every quark measurement until it essentially becomes zero (a fraction raised to a large exponent is a very small value). On the other hand, MWT argues that the experimenter always has a 100% chance of living in some parallel universe and he/she has encountered quantum immortality.

When the quark measurement is processed, there are two possibilities: the weapon can either fire or not fire. At this moment, MWT claims that the universe splits into two different universes to account for the two endings. The weapon will discharge in one reality, but not discharge in the other. For moral reasons, scientists cannot use Moravec’s experiment to disprove or corroborate the existence of parallel worlds, as the test subjects may only be dead in that particular reality and still alive in another parallel universe. In any case, the peculiar Many-World’s Theory and its startling implications challenges everything we know about the world.

Sources: Scientific American

Tagged as:
Astronomy,
Hugh Everett,
Many-Worlds theory,
Parallel Universes

NASA's Chandra Observatory Searches for Trigger of Nearby Supernova

NASA's Chandra Observatory Searches for Trigger of Nearby Supernova:

M82 SN2014J

New data from NASA's Chandra X-ray Observatory has provided stringent constraints on the environment around one of the closest supernovas discovered in decades. The Chandra results provide insight into possible cause of the explosion, as described in our press release.

On January 21, 2014, astronomers witnessed a supernova soon after it exploded in the Messier 82, or M82, galaxy. Telescopes across the globe and in space turned their attention to study this newly exploded star, including Chandra. Astronomers determined that this supernova, dubbed SN 2014J, belongs to a class of explosions called "Type Ia" supernovas. These supernovas are used as cosmic distance-markers and played a key role in the discovery of the Universe's accelerated expansion, which has been attributed to the effects of dark energy. Scientists think that all Type Ia supernovas involve the detonation of a white dwarf. One important question is whether the fuse on the explosion is lit when the white dwarf pulls too much material from a companion star like the Sun, or when two white dwarf stars merge. This image contains Chandra data, where low, medium, and high-energy X- rays are red, green, and blue respectively. The boxes in the bottom of the image show close-up views of the region around the supernova in data taken prior to the explosion (left), as well as data gathered on February 3, 2014, after the supernova went off (right). The lack of X-rays detected by Chandra is an important clue for astronomers looking for the exact mechanism of how this star exploded.

The non-detection of X-rays reveals that the region around the site of the supernova explosion is relatively devoid of material. Astronomers expect that if a white dwarf exploded because it had been steadily collecting matter from a companion star prior to exploding, the mass transfer process would not be 100% efficient, and the white dwarf would be immersed in a cloud of gas. If a significant amount of material were surrounding the doomed star, the blast wave generated by the supernova would have struck it by the time of the Chandra observation, producing a bright X-ray source. Since they do not detect any X-rays, the researchers determined that the region around SN 2014J is exceptionally clean.

More information at http://chandra.harvard.edu/photo/2014/m82/index.html

-Megan Watzke, CXC

Watching the Winds Where Sea Meets Sky

Watching the Winds Where Sea Meets Sky:

SeaWinds scatterometer chart
The SeaWinds scatterometer on NASA's QuikScat satellite stares into the eye of 1999's Hurricane Floyd as it hits the U.S. coast. The arrows indicate wind direction, while the colors represent wind speed, with orange and yellow being the fastest. NASA/JPL-Caltech


August 13, 2014

The ocean covers 71 percent of Earth's surface and affects weather over the entire globe. Hurricanes and storms that begin far out over the ocean affect people on land and interfere with shipping at sea. And the ocean stores carbon and heat, which are transported from the ocean to the air and back, allowing for photosynthesis and affecting Earth's climate. To understand all these processes, scientists need information about winds near the ocean's surface.

NASA's ISS-RapidScat, launching to the International Space Station this fall, will watch those winds with a tried and true instrument called a scatterometer. Since satellite scatterometers began collecting data in the 1970s, their soundings have become essential to our understanding of Earth's ocean winds.

Scatterometers send microwave pulses to Earth's surface at an angle. A smooth ocean surface reflects most of the energy like a mirror, away from the satellite, but strong waves scatter some of the signal back toward the spacecraft. From the strength of this backscatter, scientists can estimate the speed and direction of wind at the ocean's surface.

"Before scatterometers, we could only measure ocean winds on ships, and sampling from ships is very limited," said Timothy Liu of NASA's Jet Propulsion Laboratory in Pasadena, California, who led the science team for NASA's QuikScat mission.

Scatterometry began to emerge during World War II, when scientists realized wind disturbing the ocean's surface caused noise in their radar signals. NASA included an experimental scatterometer in its first space station in 1973 and again when it launched its SeaSat satellite in 1978. During its three-month life, SeaSat's scatterometer provided scientists with more individual wind observations than ships had collected in the previous century.

Chart

A JPL team then designed a mission called NSCAT, the NASA Scatterometer. When the Japanese spacecraft carrying NSCAT failed in 1997, engineers rushed to complete JPL's SeaWinds scatterometer instrument, already in development. In just a year, JPL engineers finished the SeaWinds scatterometer, and Ball Aerospace & Technologies Corporation created a satellite from another project's leftover parts. NASA named the expedited mission "QuikScat."

"We had to build the SeaWinds instrument using spare parts and do it very fast," Liu said. "It was only meant to be a gap-filler. But then it lasted for 10 years."

From 1999 until 2009, QuikScat collected 400,000 measurements over 90 percent of Earth's surface daily. Researchers used the data to improve weather forecasts, monitor typhoons and hurricanes, design shipping routes and place ocean fisheries. Scientists also found that SeaWinds could measure snow cover, identify icebergs floating near Antarctica and track the shrinking of the Amazon rainforest.

The number of scatterometers in space grew drastically during QuikScat's decade. "It used to be, we were the only game in town. Now there's an international array of scatterometers up there," Liu said.

Chart

QuikScat provided its full range of data until its antenna stopped spinning in 2009, significantly reducing the amount of Earth's surface it measured. But the data it continues to collect are now used to calibrate measurements from other satellites.

"We tipped QuikScat slightly so it was at the same angle as the Indian scatterometer, OSCAT, and continued to do that throughout the whole OSCAT mission," said JPL's Phil Callahan, the data products manager for QuikScat. Cross-calibrating new instruments like OSCAT with existing ones ensures that the new data can be combined seamlessly with the old, allowing researchers to examine long-term trends.

When NASA's ISS-RapidScat mission begins collecting data this fall, it will add data to the same archive.

"OSCAT stopped working earlier this year, so RapidScat's presence is very important," said Howard Eisen, the RapidScat project manager at JPL. "We can transfer the calibration standard from QuikScat to RapidScat, which can then pass it on to future scatterometers, making a continuous, 15-plus year record."

As with QuikScat, JPL engineers built RapidScat in less than two years. The mission combines new industrial-grade hardware and older inherited hardware used to develop and test QuikScat, and was developed for just $26 million. QuikScat will calibrate the new mission as well.

Chart

Also as with QuikScat, RapidScat is meant to be a "gap-filler" on its two-year mission. Another scatterometer from the Indian Space Research Organization is scheduled to join RapidScat in orbit in the next two years. RapidScat will be the last scatterometer built from SeaWinds materials, but likely not the last in a growing record of Earth's winds over the ocean.

"Including RapidScat, we've gotten three scatterometers and more than 10 years of data from the SeaWinds project," Callahan said.

For more information about ISS-RapidScat, visit:

http://winds.jpl.nasa.gov/missions/RapidScat/

ISS-RapidScat is one of five new NASA missions launching in 2014. NASA monitors Earth's vital signs from land, air and space with a fleet of satellites and ambitious airborne and ground-based observation campaigns. NASA develops new ways to observe and study Earth's interconnected natural systems with long-term data records and computer analysis tools to better see how our planet is changing. The agency shares this unique knowledge with the global community and works with institutions in the United States and around the world that contribute to understanding and protecting our home planet.

For more information about NASA's Earth science activities in 2014, visit:

http://www.nasa.gov/earthrightnow

Alan Buis

818-354-0474

Jet Propulsion Laboratory, Pasadena, California

Alan.Buis@jpl.nasa.gov


Written by Rosalie Murphy

JPL Earth Science and Technology Directorate


2014-276