Photos of Nature, Nature Photography Across The Universe. All about Nature, Love, Travel, Beautiful Photo, Landscape, Sunset, Summer, Mountains, Flowers, Photographer, Wallpaper, Portrait, Photo, what is the Universe
Photos of Nature | Nature Photography What is The Universe
When the Juno mission reached Jupiter on July 5th, 2016, it became the second mission in history to establish orbit around the Solar System’s largest planet. And in the course of it conducting its many orbits, it has revealed some interesting things about Jupiter. This has included information about its atmosphere, meteorological phenomena, gravity, and its powerful magnetic fields.
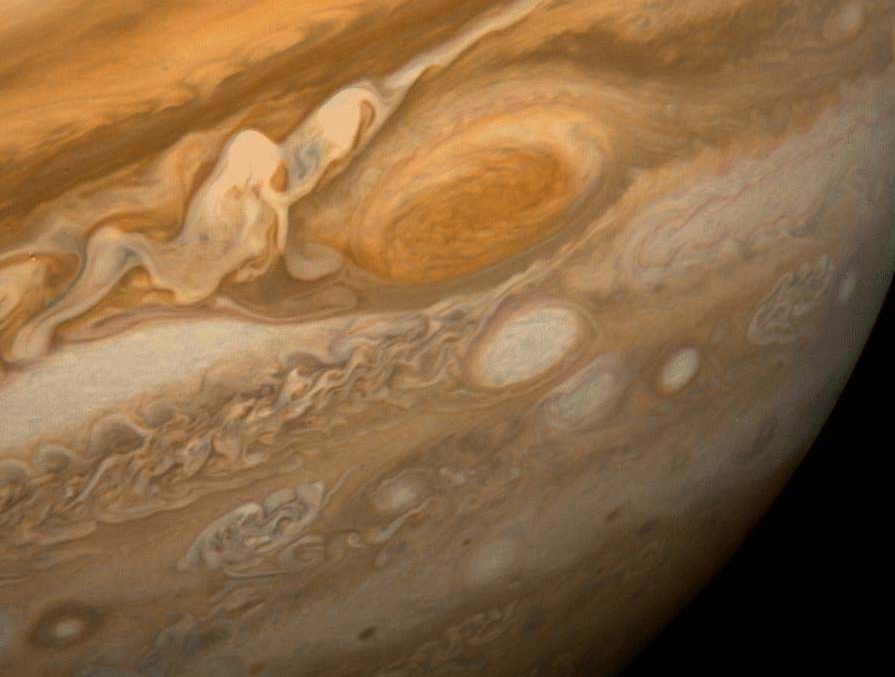
And just yesterday – on Monday, July 10th at 7:06 p.m. PDT (11:06 p.m. EDT) – just days after the probe celebrated its first year of orbiting the planet, the Juno mission passed directly over Jupiter’s most famous feature – the Great Red Spot. This massive anticyclonic storm has been a focal point for centuries, and Juno’s scheduled flyby was the closest any mission has ever come to it.
Jupiter’s Great Red Spot was first observed during the late 17th century, either by Robert Hooke or Giovanni Cassini. By 1830, astronomers began monitoring this anticyclonic storm, and have noted periodic expansions and regressions in its size ever since. Today, it is 16,000 kilometers (10,000 miles) in diameter and reaches wind speeds of 120 meters per second (432 km/h; 286 mph) at the edges.
The Juno spacecraft isn’t the first one to visit Jupiter. Galileo went there in the mid 90’s, and Voyager 1 snapped a nice picture of the clouds on its mission. Credit: NASA
As part of its sixth orbit of Jupiter’s turbulent cloud tops, Juno passed close to Jupiter’s center (aka. perijove), which took place at 6:55 p.m. PDT (9:55 p.m. EDT). Eleven minutes later – at 7:06 p.m. PDT (10:06 p.m. EDT) – the probe flew over the Great Red Spot. In the process, Juno was at a distance of just 9,000 km (5,600 miles) from the anticyclonic storm, which is the closest any spacecraft has ever flown to it.
During the flyby, Juno had all eight of its scientific instruments (as well its imager, the JunoCam) trained directly on the storm. With such an array aimed at this feature, NASA expects to learn more about what has been powering this storm for at least the past three and a half centuries. As Scott Bolton, the principal investigator of Juno at the Southwest Research Institute (SwRI), said prior to the event in a NASA press release:
“Jupiter’s mysterious Great Red Spot is probably the best-known feature of Jupiter. This monumental storm has raged on the Solar System’s biggest planet for centuries. Now, Juno and her cloud-penetrating science instruments will dive in to see how deep the roots of this storm go, and help us understand how this giant storm works and what makes it so special.”
This perijove and flyby of the Giant Red Spot also comes just days after Juno celebrated its first anniversary around Jupiter. This took place on July 4th at 7:30 p.m. PDT (10:30 p.m. EDT), at which point, Juno had been in orbit around the Jovian planet for exactly one year. By this time, the spacecraft had covered a distance of 114.5 million km (71 million mi) while orbiting around the planet.
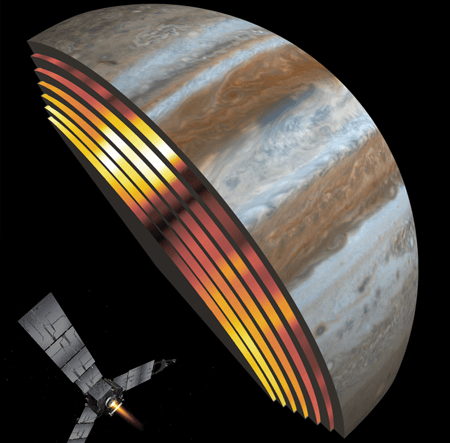
This artist’s illustration shows Juno’s Microwave Radiometer observing deep into Jupiter’s atmosphere. The image shows real data from the 6 MWR channels, arranged by wavelength. Credit: NASA/SwRI/JPL
The information that Juno has collected in that time with its advanced suite of instruments has already provided fresh insights into Jupiter’s interior and the history of its formation. And this information, it is hoped, will help astronomers to learn more about the Solar System’s own history of formation. And in the course of making its orbits, the probe has been put through its paces, absorbing radiation from Jupiter’s powerful magnetic field.
As Rick Nybakken, the project manager for Juno at NASA’s Jet Propulsion Laboratory, put it:
“The success of science collection at Jupiter is a testament to the dedication, creativity and technical abilities of the NASA-Juno team. Each new orbit brings us closer to the heart of Jupiter’s radiation belt, but so far the spacecraft has weathered the storm of electrons surrounding Jupiter better than we could have ever imagined.”
The Juno mission is set to conclude this coming February, after completing 6 more orbits of Jupiter. At this point, and barring any mission extensions, the probe will be de-orbited to burn up in Jupiter’s outer atmosphere. As with the Galileo spacecraft, this is meant to avoid any possibility of impact and biological contamination with one of Jupiter’s moons.
The Solar System is a beautiful thing to behold. Between its four terrestrial planets, four gas giants, multiple minor planets composed of ice and rock, and countless moons and smaller objects, there is simply no shortage of things to study and be captivated by. Add to that our Sun, an Asteroid Belt, the Kuiper Belt, and many comets, and you’ve got enough to keep your busy for the rest of your life.
But why exactly is it that the larger bodies in the Solar System are round? Whether we are talking about moon like Titan, or the largest planet in the Solar System (Jupiter), large astronomical bodies seem to favor the shape of a sphere (though not a perfect one). The answer to this question has to do with how gravity works, not to mention how the Solar System came to be.
Formation:
According to the most widely-accepted model of star and planet formation – aka. Nebular Hypothesis – our Solar System began as a cloud of swirling dust and gas (i.e. a nebula). According to this theory, about 4.57 billion years ago, something happened that caused the cloud to collapse. This could have been the result of a passing star, or shock waves from a supernova, but the end result was a gravitational collapse at the center of the cloud.
Due to this collapse, pockets of dust and gas began to collect into denser regions. As the denser regions pulled in more matter, conservation of momentum caused them to begin rotating while increasing pressure caused them to heat up. Most of the material ended up in a ball at the center to form the Sun while the rest of the matter flattened out into disk that circled around it – i.e. a protoplanetary disc.
The planets formed by accretion from this disc, in which dust and gas gravitated together and coalesced to form ever larger bodies. Due to their higher boiling points, only metals and silicates could exist in solid form closer to the Sun, and these would eventually form the terrestrial planets of Mercury, Venus, Earth, and Mars. Because metallic elements only comprised a very small fraction of the solar nebula, the terrestrial planets could not grow very large.
In contrast, the giant planets (Jupiter, Saturn, Uranus, and Neptune) formed beyond the point between the orbits of Mars and Jupiter where material is cool enough for volatile icy compounds to remain solid (i.e. the Frost Line). The ices that formed these planets were more plentiful than the metals and silicates that formed the terrestrial inner planets, allowing them to grow massive enough to capture large atmospheres of hydrogen and helium.
The leftover debris that never became planets congregated in regions such as the Asteroid Belt, the Kuiper Belt, and the Oort Cloud. So this is how and why the Solar System formed in the first place. Why is it that the larger objects formed as spheres instead of say, squares? The answer to this has to do with a concept known as hydrostatic equilibrium.
Hydrostatic Equilibrium:
In astrophysical terms, hydrostatic equilibrium refers to the state where there is a balance between the outward thermal pressure from inside a planet and the weight of the material pressing inward. This state occurs once an object (a star, planet, or planetoid) becomes so massive that the force of gravity they exert causes them to collapse into the most efficient shape – a sphere.
Typically, objects reach this point once they exceed a diameter of 1,000 km (621 mi), though this depends on their density as well. This concept has also become an important factor in determining whether an astronomical object will be designated as a planet. This was based on the resolution adopted in 2006 by the 26th General Assembly for the International Astronomical Union.
In accordance with Resolution 5A, the definition of a planet is:
A “planet” is a celestial body that (a) is in orbit around the Sun, (b) has sufficient mass for its self-gravity to overcome rigid body forces so that it assumes a hydrostatic equilibrium (nearly round) shape, and (c) has cleared the neighborhood around its orbit.
A “dwarf planet” is a celestial body that (a) is in orbit around the Sun, (b) has sufficient mass for its self-gravity to overcome rigid body forces so that it assumes a hydrostatic equilibrium (nearly round) shape [2], (c) has not cleared the neighborhood around its orbit, and (d) is not a satellite.
All other objects, except satellites, orbiting the Sun shall be referred to collectively as “Small Solar-System Bodies”.
Montage of every round object in the solar system under 10,000 kilometers in diameter, to scale. Credit: Emily Lakdawalla/data from NASA /JPL/JHUAPL/SwRI/SSI/UCLA/MPS/DLR/IDA/Gordan Ugarkovic/Ted Stryk, Bjorn Jonsson/Roman Tkachenko
So why are planets round? Well, part of it is because when objects get particularly massive, nature favors that they assume the most efficient shape. On the other hand, we could say that planets are round because that is how we choose to define the word “planet”. But then again, “a rose by any other name”, right?
Earlier this week, on Monday, July 10th, the Juno mission accomplished an historic feet as it passed directly over Jupiter’s most famous feature – the Great Red Spot. This massive anticyclonic storm has been raging for centuries, and Juno’s scheduled flyby was the closest any mission has ever come to it. It all took place at 7:06 p.m. PDT (11:06 p.m. EDT), just days after the probe celebrated its first year of orbiting the planet.
And today – Wednesday, July 12th, a few days ahead of schedule – NASA began releasing the pics that Juno snapped with its imager – the JunoCam – to the public. As part of the missions’ seventh orbit around the planet (perijove 7) these images are the closest and most detailed look of Jupiter’s Great Red Spot to date. And as you can clearly see by going to the JunoCam website, the pictures are a sight to behold!
And as always, citizen scientists and amateur astronomers are already busy processing the images. This level of public involvement in a NASA mission is something quite new. Prior to every perijove, NASA has asked for public input on what features they would like to see imaged. These Points of Interest (POIs), as they are called, are then photographed, and the public has had the option of helping to process them for public consumption.
As Scott Bolton – the associate VP at the Southwest Research Institute (SwRI) and the Principle Investigator (PI) of the Juno mission – said in a NASA press release, “For generations people from all over the world and all walks of life have marveled over the Great Red Spot. Now we are finally going to see what this storm looks like up close and personal.” And in just the past two days, several processed images have already come in.
Consider the images that were processed by Jason Major – an amateur astronomer and graphic designer who created the astronomy website Lights in the Dark. In the image above (his own work), we see a cropped version of the original JunoCam image in order to put Jupiter’s Great Red Spot center-frame. It was then color-adjusted and enhanced to mark the boundaries of the storm’s “eye” and the swirling clouds that surround it more clearly.
On his website, Major described the method he used to bring this image to life:
“[T]he image above is my first rendering made from a map-projected PNG file which centers and fully-frames the giant storm in contrast- and color-enhanced detail… The resolution is low but this is what my “high-speed” workflow is set up for—higher resolution images will take more time and I’m anticipating some incredible versions to be created and posted later today and certainly by tomorrow and Friday by some of the processing superstars in the imaging community (Kevin, Seán, Björn, Gerald, I’m looking at you!)”
Above is another one of Major’s processed images, which was released shortly after the first one. This image shows the GRS in a larger context, using the full JunoCam image, and similarly processed to show contrasts. The same image was processed and submitted to the Juno website by amateur astronomers Amadeo Bellotti and Oliver Jenkins – though their submissions are admittedly less clear and colorful than Major’s work.
Other images include “Juno Eye“, a close up of Jupiter’s northern hemisphere that was processed by our good friend, Kevin M. Gill. Shown below, this image is a slight departure from the others (which focused intently on Jupiter’s Great Red Spot) to capture a close-up of the swirls in Jupiter’s northern polar atmosphere. Much like the GRS, these swirls are eddies that are created by Jupiter’s extremely high winds.
The Juno mission reached perijove – i.e. the point in its orbit where it is closest to Jupiter’s center – on July 10th at 6:55 p.m. PDT (9:55 p.m. EDT). At this time, it was about 3,500 km (2,200 mi) above Jupiter’s cloud tops. Eleven minutes and 33 seconds later, it was passing directly over the anticyclonic storm at a distance of about 9,000 km (5,600 mi); at which time, all eight of its instruments were trained on the feature.
In addition to the stunning array of images Juno has sent back, its suite of scientific instruments have gathered volumes of data on this gas giant. In fact, the early science results from the mission have shown just how turbulent and violent Jupiter’s atmosphere is, and revealed things about its complex interior structure, polar aurorae, its gravity and its magnetic field.
The Juno mission reached Jupiter on July 5th, 2016, becoming the second probe in history to establish orbit around the planet. By the time the mission is scheduled to end in 2018 (barring any mission extensions), scientist hope to have learned a great deal about the planet’s structure and history of formation.
Given that this knowledge is likely to reveal things about the early history and formation of the Solar System, the payoffs from this mission are sure to be felt for many years to come after it is decommissioned.
In the meantime, you can check out all the processed images by going to the JunoCam sight, which is being regularly updated with new photos from Perijove 7!
One of the most significant finds to come from our ongoing exploration and research efforts of Mars is the fact that the planet once had a warmer, wetter environment. Between 4.2 and 3.7 billion years ago, the planet had a thicker atmosphere and was able to maintain liquid water on its surface. As such, it has been ventured that life could have once existed there, and might still exist there in some form.
However, according to some recent lab tests by a pair of researchers from the UK Center for Astrobiology at the University of Edinburgh, Mars may be more hostile to life than previously thought. Not only does this not bode well for those currently engaged in the hunt for life on Mars (sorry Curiosity!), it could also be bad news for anyone hoping to one day grow things on the surface (sorry Mark Watney!).
Their study, titled “Perchlorates on Mars Enhance the Bacteriocidal Effects of UV Light“, was recently published in the journal Science Reports. Performed by Jennifer Wadsworth and Charles Cockell – a postgraduate student and a professor of astrobiology at the UK Center for Astrobiology, respectively – the purpose of this study was to see how perchlorates (a chemical compound that is common to Mars) behaved under Mars-like conditions.
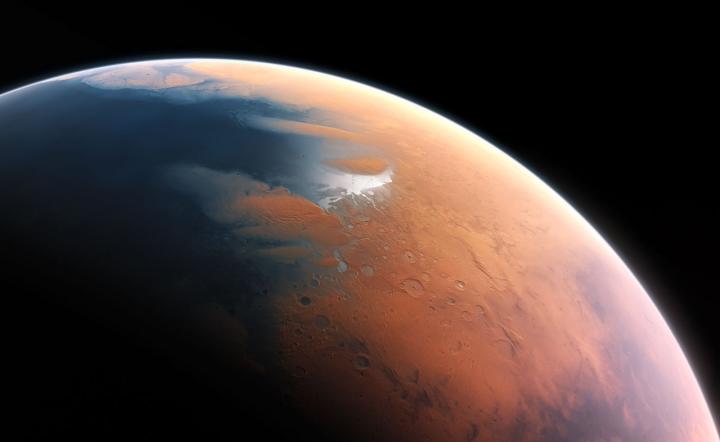
An artist’s impression of what Mars might have looked like with water, when any potential Martian microbes would have evolved. Credit: ESO/M. Kornmesser
Basically, perchlorates are a negative ion of chlorine and oxygen (ClO-4) that are found on Earth. When the Pheonix lander touched down on Mars in 2008, it found that this chemical was also found on the Red Planet. While stable at room temperature, perchlorates become active when exposed to high levels of heat energy. And under the kinds of conditions associated with Mars, they become rather toxic.
Interestingly enough, the presence of perchlorates on the surface of Mars was presented in 2015 as evidence of there being liquid water there in the past. This was due to the fact that these compounds were found both in-situ and as part of what are known as “brine sweeps”. In other words, some of the discovered perchlorates took the form of streaky lines that were thought to have been the result of water evaporating.
Water, as we all know, is also an essential ingredient to life as we know it, and it’s discovery of Mars was seen as evidence that life could have once existed there. Hence, as Jennifer Wadsworth (the study’s lead author) told Universe Today via email, she and Dr. Cockell were interested to see how such compounds would behave under conditions that are particular to Mars:
“There is a relatively large amount of perchlorate on Mars (0.6 weight percent) and it was confirmed to be a component of a Martian brine by NASA in 2015. It has been speculated that these brines may be habitable. There has been previous work done showing that perchlorates can be ‘activated’ by ionizing radiation which leads them to chlorinate amino acids and degrade organics. We wanted to test whether perchlorate could be activated by UV under Martian environmental conditions to directly kill bacteria. We thought it would be interesting to investigate in light of the discussions of brine habitability.”
Scientists were able to gauge the rate of water loss on Mars by measuring the ratio of water
After recreating the temperature conditions that are common to the Martian surface, Wadsworth and Cockell began exposing the samples to ultra-violet light – which the surface of Mars gets plenty of exposure to. What they found was that under cold conditions, the samples became activated when exposed to UV radiation. And As Wadsworth explained, the results were less than encouraging:
“The main results were that perchlorate, that is usually only activated at high temperatures, can be activated by only using UV light. This is interesting because this compound is abundant on Mars (where it’s very cold), so we might have previously thought it wouldn’t be possible to activate it under Martian conditions. We also found the bactericidal effect increased when bacteria were irradiated with perchlorate and other Martian compounds (iron oxide and hydrogen peroxide). This is important because it is lethal to bacteria when activated. So, if we want to find life on Mars, we have to take this into consideration.”
Iron oxide (FeO) – aka. rust – and hydrogen peroxide (H²O²) are two compounds that are also found in abundance on the surface of Mars. In fact, it is the prevalence of iron oxide in the soil that gives Mars its distinct, reddish appearance. When Wadsworth and Cockell added these compounds to the perchlorates, the result was nothing less than a 10.8-fold increase in the death of bacterial cells, when compared to perchlorates alone.
While the surface of Mars has long been suspected of having toxic effects, this study shows that it could actually be very hostile to living cells. Thanks to the toxic combination that is created when these three chemical compounds come together and are activated by UV light, the most basic of life forms may be unable to survive there. For those researchers attempting to determine if Mars could in fact be habitable, this is not good news!
Sorry, Mark Watney. Turns out, your potatoes are growing in dirt that is toxic to lifeforms. Credit: Twentieth Century Fox Film Corporation
It is also bad news as far as the existence of liquid water is concerned. While the presence of liquid water in Mars’ past was seen as compelling evidence for past habitability, this water would not have been particularly supportive for life as we know it. Not if these compounds were present in Mars’ surface water, which this study would seem to suggest. Luckily, this research does present a few silver linings.
On the one hand, the fact that perchlorates became hostile to B. subtilis in the presence of UV does not necessarily mean that the Martian surface is hostile to all life. Second, the presence of these bacteria-killing compounds means that contaminants left behind by robotic explorers are not likely to survive long. So the risk of contaminating Mars’ environment (always a going concern for any mission) is very low.
As Wadsworth explained, there are unanswered questions, and more research is necessary:
“We don’t know exactly how far reaching the effect of UV and perchlorate would penetrate the surface layers, as the precise mechanism isn’t understood. If it’s the case of altered forms of perchlorate (such as chlorite or hypochlorite) diffusing through the environment, that might extend the uninhabitable zone. If you’re looking for life you have to additionally keep the ionizing radiation in mind that can penetrate the top layers of soil, so I’d suggest digging at least a few meters into the ground to ensure the levels of radiation would be relatively low. At those depths, it’s possible Martian life may survive.”
As for all the potential Mark Watney’s out there (the protoganist from The Martian), there might be some good news as well. “Perchlorate can be dangerous to humans so we’d just have to make sure we keep it out of the austronauts’ living quarters,” said Wadsworth. “We could potentially use it in sterilization processes. I think the more immediate threat to Martian colonies would be the amount of radiation reaching the surface.”
So maybe we don’t need to cancel our tickets to Mars just yet! However, as the day draws nearer to where people like Elon Musk and Bas Lansdorp are able to make commercial trips to the Red Planet a reality, we will need to know precisely how terrestrial organisms will fare on the planet – and that includes us! And if the prospects don’t look good, we better make certain we have some decent counter-measures in place.
Discover the cosmos! Each day a different image or photograph of our fascinating universe is featured, along with a brief explanation written by a professional astronomer.
2017 July 10
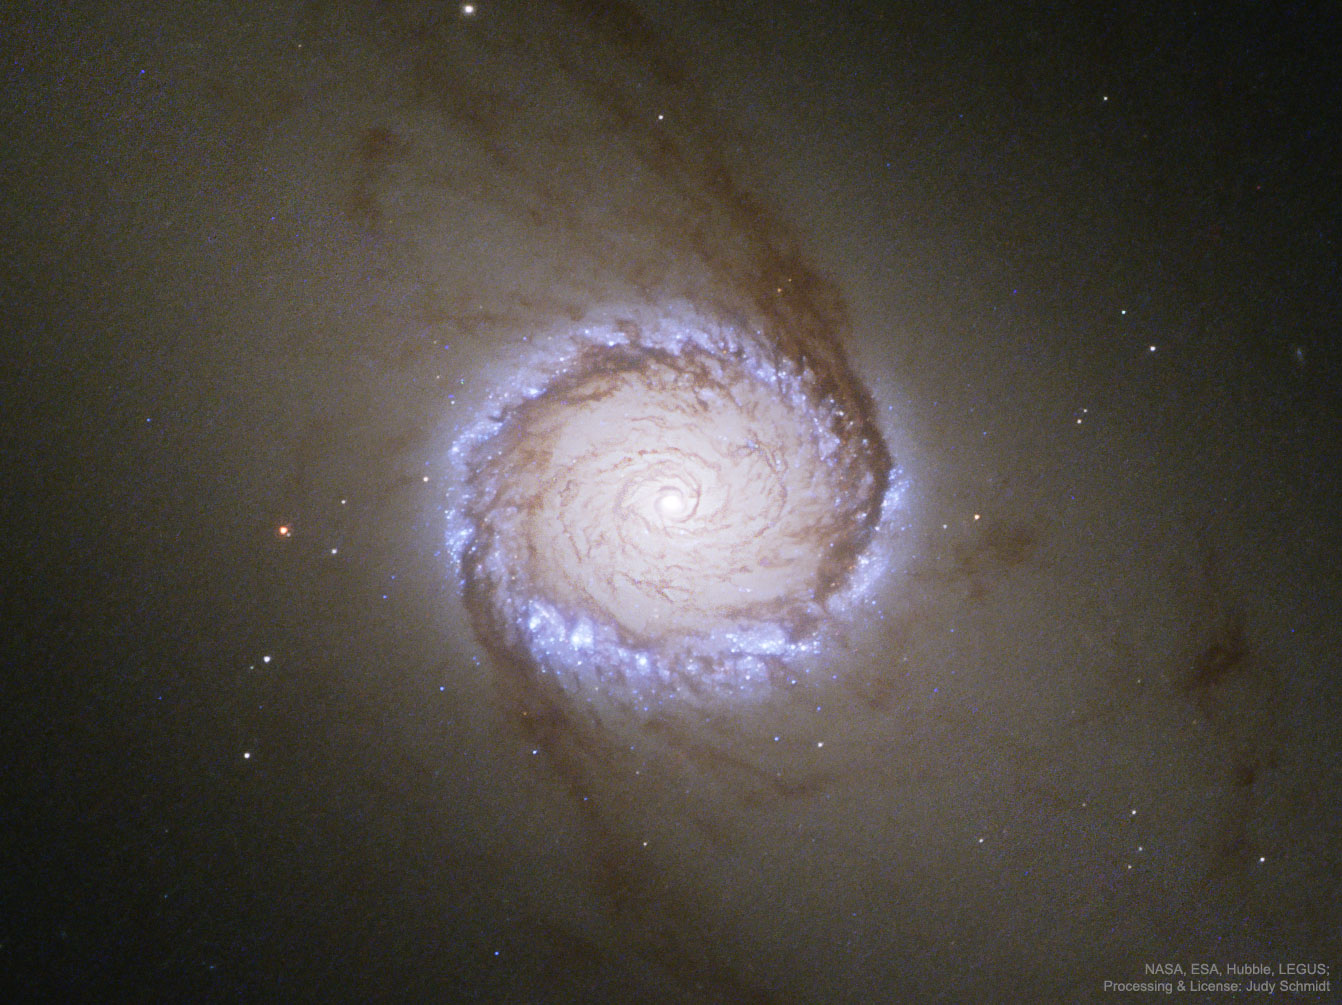
Explanation: What's happening around the center of this spiral galaxy? Seen in total, NGC 1512 appears to be a barred spiral galaxy -- a type of spiral that has a straight bar of stars across its center. This bar crosses an outer ring, though, a ring not seen as it surrounds the pictured region. Featured in this Hubble Space Telescope image is an inner ring -- one that itself surrounds the nucleus of the spiral. The two rings are connected not only by a bar of bright stars but by dark lanes of dust. Inside of this inner ring, dust continues to spiral right into the very center -- possibly the location of a large black hole. The rings are bright with newly formed stars which may have been triggered by the collision of NGC 1512 with its galactic neighbor, NGC 1510.
Discover the cosmos! Each day a different image or photograph of our fascinating universe is featured, along with a brief explanation written by a professional astronomer.
2017 July 11
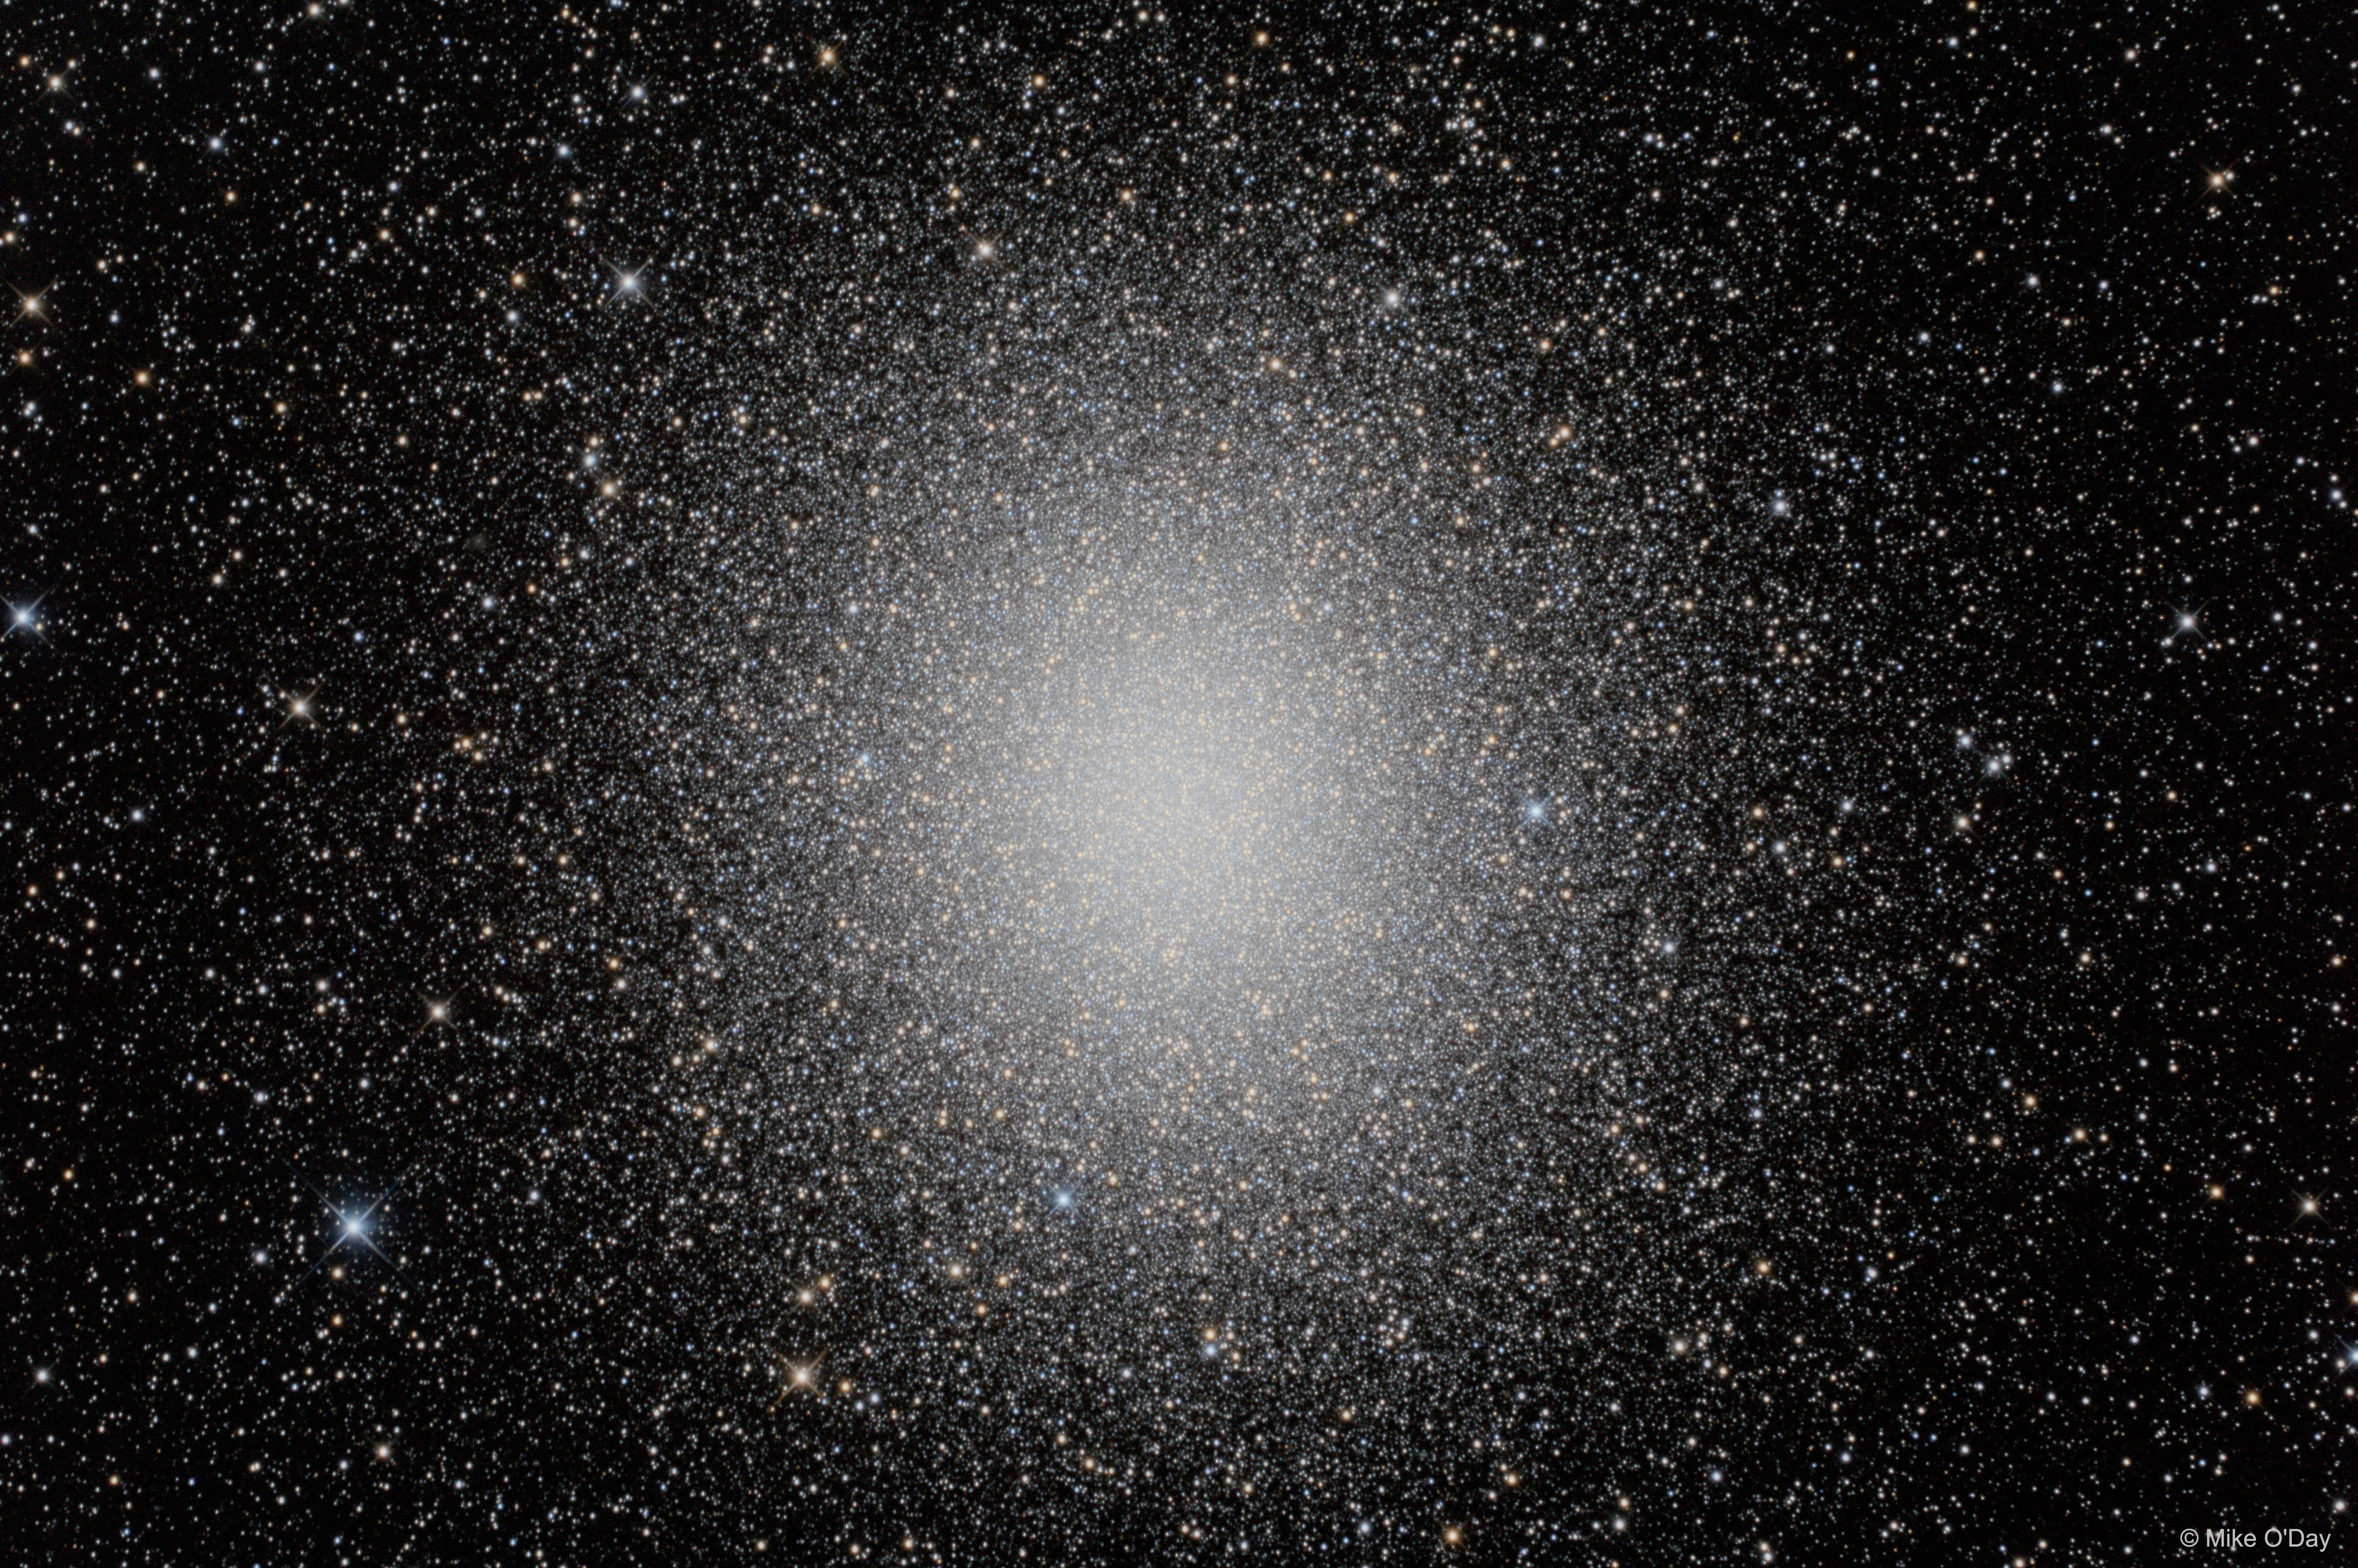
Explanation: Behold the largest ball of stars in our galaxy. Omega Centauri is packed with about 10 million stars, many older than our Sun and packed within a volume of only about 150 light-years in diameter. The star cluster is the largest and brightest of 200 or so known globular clusters that roam the halo of our Milky Way galaxy. Though most star clusters consist of stars with the same age and composition, the enigmatic Omega Cen exhibits the presence of different stellar populations with a spread of ages and chemical abundances. In fact, Omega Cen may be the remnant core of a small galaxy merging with the Milky Way. The featured image shows so many stars because it merged different exposures with high dynamic range (HDR) techniques. Omega Centauri, also known as NGC 5139, lies about 15,000 light-years away toward the southern constellation of the Centaurus.
Welcome back to Messier Monday! We continue our tribute to our dear friend, Tammy Plotner, by looking at the open star cluster of Messier 50. Enjoy!
In the 18th century, while searching the night sky for comets, French astronomer Charles Messier kept noting the presence of fixed, diffuse objects in the night sky. In time, he would come to compile a list of approximately 100 of these objects, with the purpose of making sure that astronomers did not mistake them for comets. However, this list – known as the Messier Catalog – would go on to serve a more important function.
One of these objects is the open star cluster known as Messier 50 (aka. NGC 2323). Located at a distance of about 3,200 light-years from Earth, this object sits near the border between the Monoceros and Canis Major constellations. It is described as a ‘heart-shaped’ figure, occupies an area about half the size of the full Moon, and is easy to find because of its proximity to Sirius (the brightest star in the night sky).
Description:
Located about 3,200 light years from our solar system, this stellar gathering could be perhaps as much as 20 light years across, but the central concentration is believed to only span across roughly 10 light years. While that doesn’t seem that large, it’s lit by the candlepower of what could be 200 stars! And picking such a group of stars out of a well-known OB1 association isn’t easy. It requires photometry. As J.J. Claria (et al) remarked in a 1997 study:
“UBV and DDO photoelectric photometry in the field of the open cluster NGC 2323 is presented. The analysis yields 109 probable members; one of them being a red giant, and 3 possible members. The basic cluster parameters are derived. NGC 2323 appears not to be physically connected to the CMa OB1 association.”
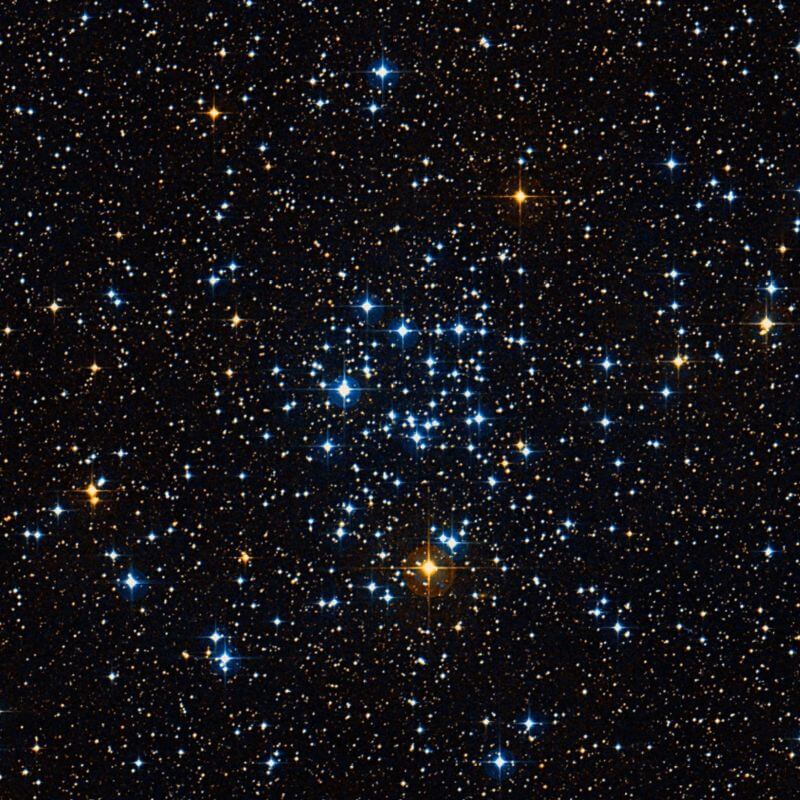
Close up of the Messier 50 open star cluster. Credit: Wikisky
In this region of the sky are vast molecular clouds compressing into star forming regions known as OB1 associations. The stars spawned by these vast clouds form into open clusters containing dozens to thousands of members and, over time, disassociate with not only the molecular cloud, but their sibling star clusters as well. Sure, it took 100-120 million years for it to happen, but as the group of stars cut away from the field, each member also aged differently.
By studying open clusters like M50 and its relative M35, we can learn more about the dynamics of star clusters which formed roughly at the same time in the same area. As Jasonjot Kalirai (et al) indicated in their 2003 study:
“The color-magnitude diagrams for the clusters exhibit clear main sequences stretching over 14 mag in the (V, B-V)-plane. Comparing these long main sequences with those of earlier clusters in the survey, as well as with the Hyades, has allowed for accurate distances to be established for each cluster. Analysis of the luminosity and mass functions suggests that, despite their young ages, both clusters are somewhat dynamically relaxed, exhibiting signs of mass segregation. This is especially interesting in the case of NGC 2323, which has an age of only 1.3 times the dynamical relaxation time. The present photometry is also deep enough to detect all of the white dwarfs in both clusters. We discuss some interesting candidates that may be the remnants of quite massive (M>=5Msolar) progenitor stars. The white dwarf cooling age of NGC 2168 is found to be in good agreement with the main-sequence turnoff age. These objects are potentially very important for setting constraints on the white dwarf initial-final mass relationship and the upper mass limit for white dwarf production.”
So, did age or movement produce the colorful display of stars we can observe in M50 – or was it simply the chemical ingredients responsible? According to a 2005 study conducted by Bragaglia and Monica:
“We describe a long-term project aimed at deriving information on the chemical evolution of the Galactic disk from a large sample of open clusters. The main property of this project is that all clusters are analyzed in a homogeneous way to guarantee the robustness of the ranking in age, distance, and metallicity. Special emphasis is devoted to the evolution of the earliest phases of the Galactic disk evolution, for which clusters have superior reliability with respect to other types of evolution indicators. The project is twofold: on one hand we derive the age, distance, and reddening (and indicative metallicity) by interpreting deep and accurate photometric data with stellar evolution models, and on the other hand, we derive the chemical abundances from high-resolution spectroscopy. The importance of quantifying the theoretical uncertainties by deriving the cluster parameters with various sets of stellar models is emphasized. Stellar evolution models assuming overshooting from convective regions appear to better reproduce the photometric properties of the cluster stars. The examined clusters show a clear metallicity dependence on the galactocentric distance and no dependence on age. The tight relation between cluster age and magnitude difference between the main-sequence turnoff and the red clump is confirmed.”
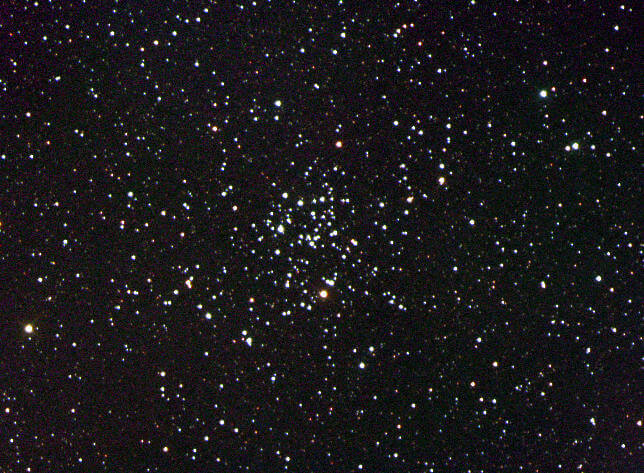
The M50 open cluster. Credit: Ole Nielsen
History of Observation:
While M50 was possibly discovered by G.D. Cassini 1711, it was independently recovered by Charles Messier on the night of April 5th, 1772. In his notes, he wrote of his discovery:
“Cluster of small stars, more or less brilliant, above the right loins of the Unicorn, above the star Theta of the ear of Canis Major, & near a star of 7th magnitude. It was while observing the Comet of 1772 that M. Messier observed this cluster. He has reported it on the chart of that comet, on which its trace has been drawn.”
It would later be observed by William Hershel, but not until his son John cataloged it before anyone began to notice colors in the stars. However, Admiral Smyth did!
“This is an irregularly round and very rich mass, occupying with its numerous outliers more than the field, and composed of stars from the 8th to the 16th magnitudes; and there are certain spots of splendour which indicate minute masses beyond the power of my telescope. The most decided points are, a red star towards the southern verge, and a pretty little equilateral triangle of 10th sizers, just below, or north of it. The double star here noted was carefully estimated under a full knowledge of the vertical and parallel lines of the field of view: this was made triple by H. [John Herschel], whose 2357 of the Fifth Series it is; but he must be mistaken in calling it Struve 748, which is Theta Orionis. It is sufficiently conspicuous as a double star, and though I perceive an infinitesimal point exactly om the vertical of A, I cannot ascertain whether it is H.’s C. This superb object was discovered by Messier in 1771 [actually 1772], and registered “a mass of small stars more or less brilliant.” It is 9 deg north-north-east of Sirius, and rather more than one-third of the distance between that star and Procyon.”
Locating Messier 50:
Because M50 is such a big and bright open star cluster, it’s relatively easy to find with complicated starhop instructions. Actually, the constellation of Monoceros is more difficult! Begin by identifying the brightest star in northern hemisphere skies – Alpha Canis Major – Sirius. Roughly a handspan to the northeast you’ll see another prominent bright star – Alpha Canis Minor – Procyon.
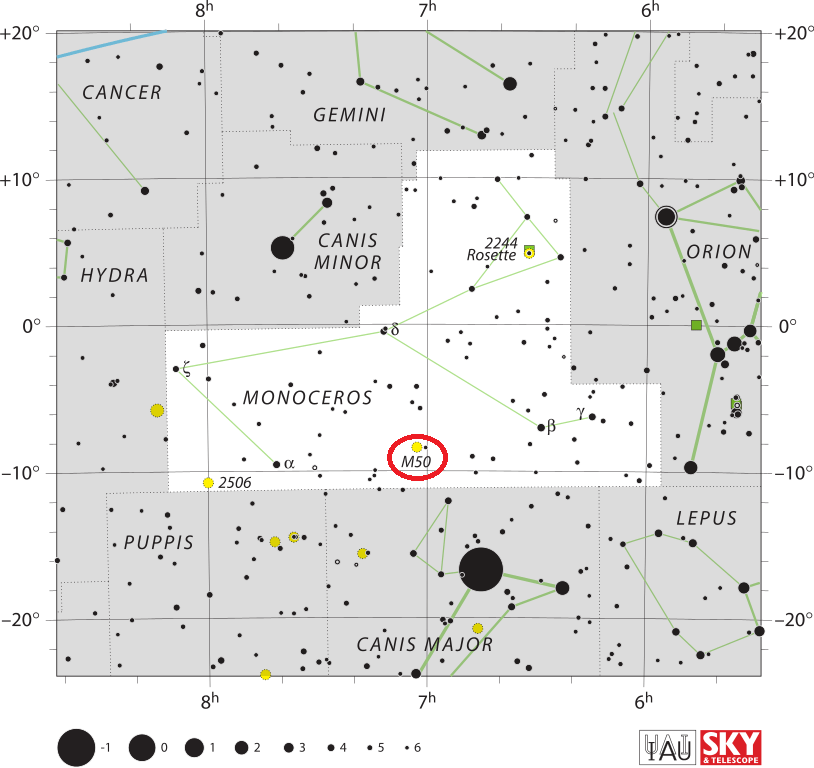
The location of Messier 50 in the Monoceros constellation. Credit: IAU/Sky & Telescope magazine (Roger Sinnott & Rick Fienberg)
Between these two lay the faint and indistinguishable constellation of Monoceros, and slightly southwest of the center point is Messier 50. In small binoculars and a telescope finderscope, you’ll quickly spot a compression in the starfield, and may even be able to see it as a slight contrast change with the unaided eye. In larger binoculars and small telescopes, it blooms into a cloud of stars, well resolved against the grainy backdrop of fainter stars.
In large aperture telescopes, even more stars resolve and colors begin to appear. Because of magnitude and the nature of star clusters, Messier 50 makes an outstanding target for high light pollution areas, moonlit nights and even less than perfect sky conditions.
Enjoy your own “colorful” observations of this rich and beautiful star cluster!
And as always, here are the quick facts on this Messier Object to help you get started:
In 2013, the European Space Agency launched the Gaia spacecraft. As the successor to the Hipparcos mission, this space observatory has spent the past three and a half years gathering data on the cosmos. Before it retires sometime next year (though the mission could be extended), this information will be used to construct the largest and most precise 3D astronomical map ever created.
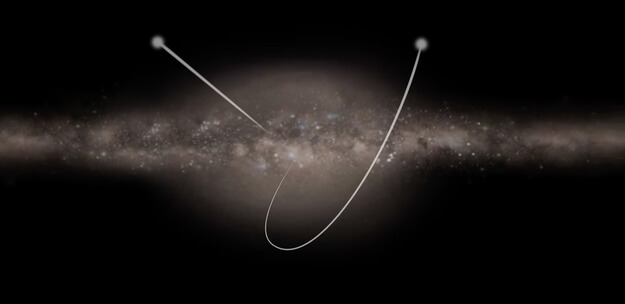
In the course of surveying the cosmos, Gaia has also revealed some very interesting things along the way. For example, after examining the Gaia catalog with a specially-designed artificial neural network, a team of European researchers recently detected six new hypervelocity stars in the Milky Way. And one of these stars is moving so fast that it may eventually leave our galaxy.
Artist’s conception of the Gaia telescope backdropped by a photograph of the Milky Way taken at the European Southern Observatory. Credit: ESA/ATG medialab; background: ESO/S. Brunier
Hypervelocity stars are a rare and fascinating thing. Whereas all stars in the Milky Way are in constant motion, orbiting around the center of our galaxy, some are accelerated to speeds of up to hundreds of kilometers per second. In the past, astronomers have deduced that these fast-moving stars are the result of a close stellar encounter or a supernova explosion of a stellar companion.
And a little over a decade ago, astronomers became aware of a new class of high-speed stars that are believed to have been accelerated from past interactions with the supermassive black hole (Sagittarius A*) that sits at the center of our galaxy. These stars are extremely important to the study of the overall structure of the Milky Way, as they are indicative of the kinds of events and forces that have shaped its history.
As Elena Maria Rossi, from Leiden University in the Netherlands and one of the co-authors on the paper, explained in an ESA press release:
“These are stars that have traveled great distances through the Galaxy but can be traced back to its core – an area so dense and obscured by interstellar gas and dust that it is normally very difficult to observe – so they yield crucial information about the gravitational field of the Milky Way from the centre to its outskirts.“
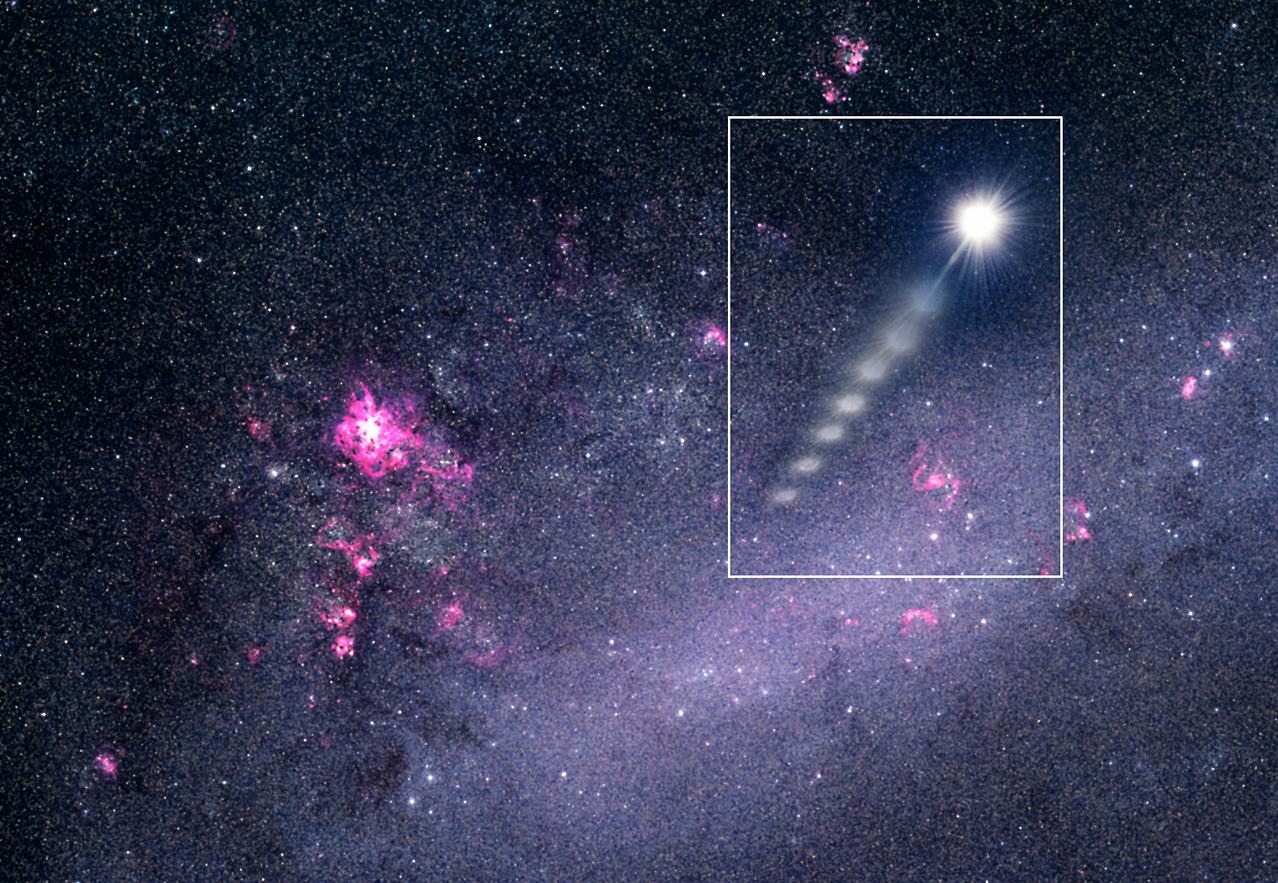
Artist’s impression of stars speeding through the Galaxy. Credit: ESA
Finding such stars is no easy task, mainly because their velocity makes them extremely difficult to spot in the vast and crowded disk of the Milky Way. As a result, scientists have relied on looking for young, massive stars (2.5 to 4 Solar masses) in the old stellar population of the Galactic. Basically, their young age and high masses are indications that they might not have originated there.
Combined with measurements of their past speeds and paths, this method has confirmed the existence of hypervelocity stars in the past. However, only 20 hypervelocity stars have been spotted to date, and they have all been young and massive in nature. Scientists believe that many more stars of other ages and masses are also being accelerated through the Milky Way, but were previously unable to spot them.
To address this, the European team – led by from Tomasso Marchetti of Leiden University in the Netherlands – began considering how to use Gaia‘s vast dataset to optimize the search for more hypervelocity stars. After testing various methods, they adopted the artificial neural net approach – i.e. using a machine learning algorithm – to search through the star census data Gaia is in the process of gathering.
Beginning in the first half of 2016, the team began developing and training this program to be ready for the first release of Gaia data – which occurred a few months later on Sept. 14th, 2016. As Tommaso Marchetti, a PhD student at Leiden University, described the process:
“In the end, we chose to use an artificial neural network, which is software designed to mimic how our brain works. After proper ‘training’, it can learn how to recognize certain objects or patterns in a huge dataset. In our case, we taught it to spot hypervelocity stars in a stellar catalogue like the one compiled with Gaia.”
Artist’s impression of a hypervelocity star that was detected using the ESO’s Very Large Telescope. Credit: ESO
In addition to a map with the positions of over a billion stars, this first data release included a smaller catalogue with the distances and motions for two million stars. This catalog – which is known as the Tycho-Gaia Astrometric Solution (TGAS) – combined data from both the first year of the Gaia mission and with data from the Hipparcos mission, and is essentially a taste of what’s to come from Gaia.
On the day of the catalog’s release, Marchetti and his team ran their algorithm on the two million stars within the TGAS, which revealed some interesting finds. “In just one hour, the artificial brain had already reduced the dataset to some 20 000 potential high-speed stars, reducing its size to about 1%,” said Rossi. “A further selection including only measurements above a certain precision in distance and motion brought this down to 80 candidate stars.”
The team then examined these 80 stars in more detail, and compared the information about their motions to data from other catalogues. Paired with additional observations, they eventually found six stars which appeared to be moving faster than 360 km/s. One even appeared to be exceeding 500 km/s, which means that it is no longer bound by the gravity of our Milky Way and will eventually leave it altogether.
But perhaps the sot significant aspect of this find is the fact these stars are not particularly massive like the previous 20 that had been discovered, and were comparable in mass to our Sun. In addition, the 5 slower stars are likely to become a focal point of study, as scientists are eager to determine what slowed them down. One possible explanation is that interaction with the galaxy’s dark matter might have been responsible.
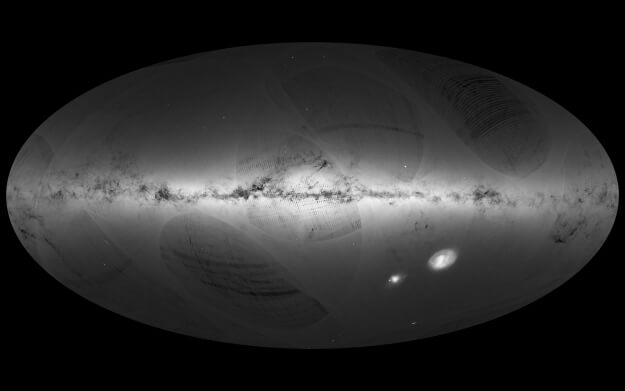
Gaia’s first sky map. Credit: ESA/Gaia/DPAC. Credit: A. Moitinho & M. Barros (CENTRA – University of Lisbon), on behalf of DPAC.
Much as the TGAS has been merely an early indication of the vast and valuable data Gaia will eventually provide, this study showcases the kinds of discoveries and research that this data will enable. By with not just 2 million, but a billion stars to study, astronomers are sure to reveal many new and exciting things about the dynamics of our Milky Way and the kinds of forces that have shaped it.
For this purpose, Marchetti and his team are upgrading their program to handle the much larger data set, which is scheduled to be released in April of 2018. This catalog will include distance and motions for over a billion stars, as well as velocities for a specific subset. From this, the team may find that fast-moving stars which are being booted out of the Milky Way are a lot more common than previously thought.
And be sure to enjoy this video that shows the paths of these six newly-discovered fast-moving stars, courtesy of the ESA:
Discover the cosmos! Each day a different image or photograph of our fascinating universe is featured, along with a brief explanation written by a professional astronomer.
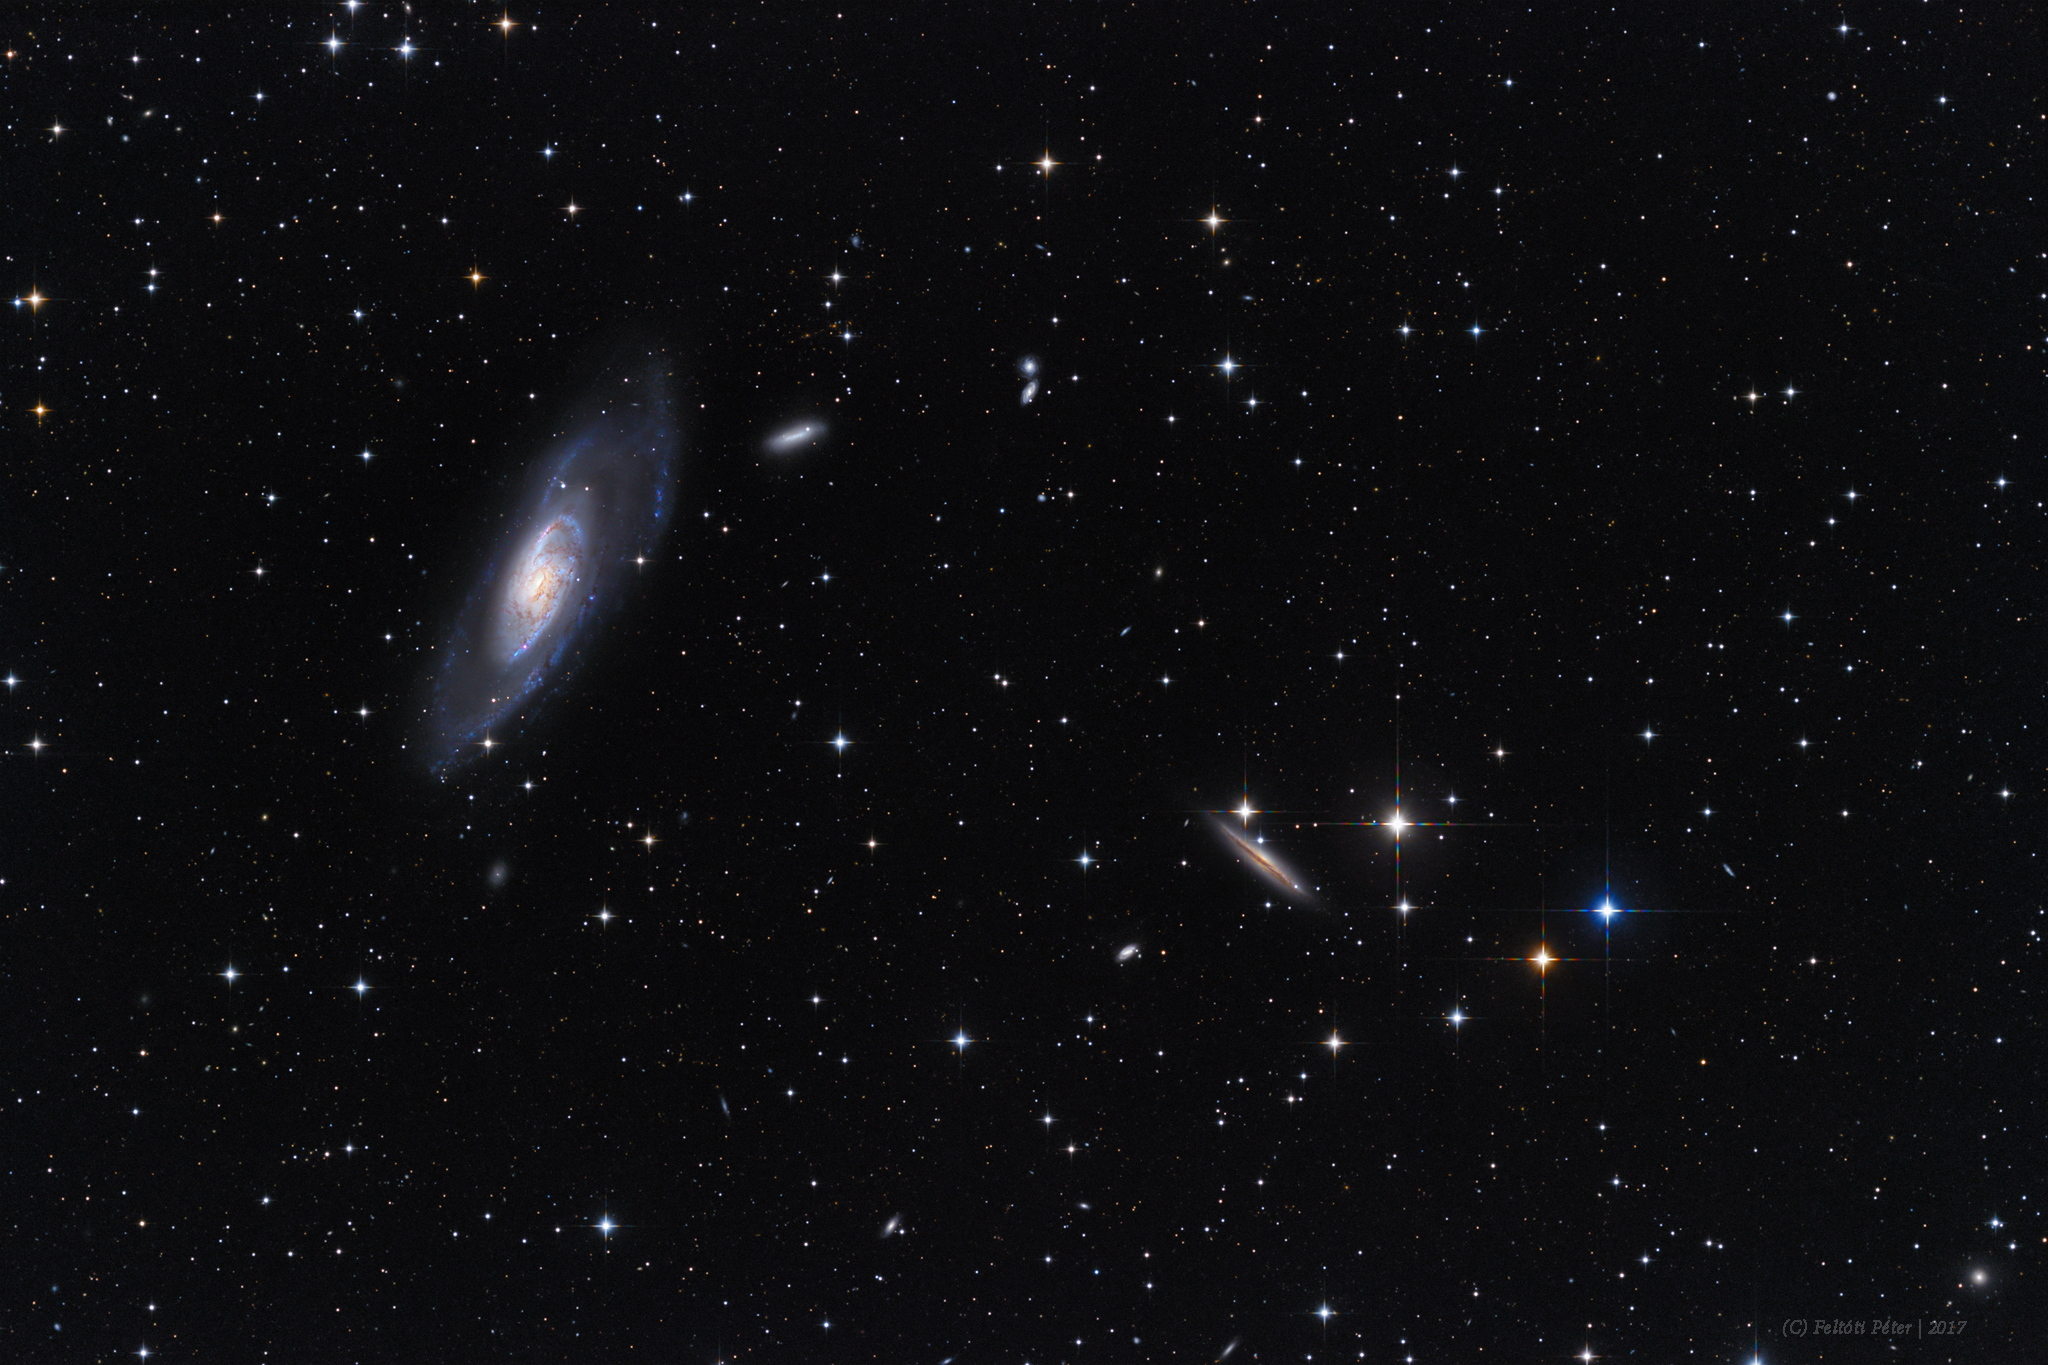
Explanation: Big, bright, beautiful spiral, Messier 106 dominates this cosmic vista. The two degree wide telescopic field of view looks toward the well-trained constellation Canes Venatici, near the handle of the Big Dipper. Also known as NGC 4258, M106 is about 80,000 light-years across and 23.5 million light-years away, the largest member of the Canes II galaxy group. For a far away galaxy, the distance to M106 is well-known in part because it can be directly measured by tracking this galaxy's remarkable maser, or microwave laser emission. Very rare but naturally occuring, the maser emission is produced by water molecules in molecular clouds orbiting its active galactic nucleus. Another prominent spiral galaxy on the scene, viewed nearly edge-on, is NGC 4217 below and right of M106. The distance to NGC 4217 is much less well-known, estimated to be about 60 million light-years.
Discover the cosmos! Each day a different image or photograph of our fascinating universe is featured, along with a brief explanation written by a professional astronomer.
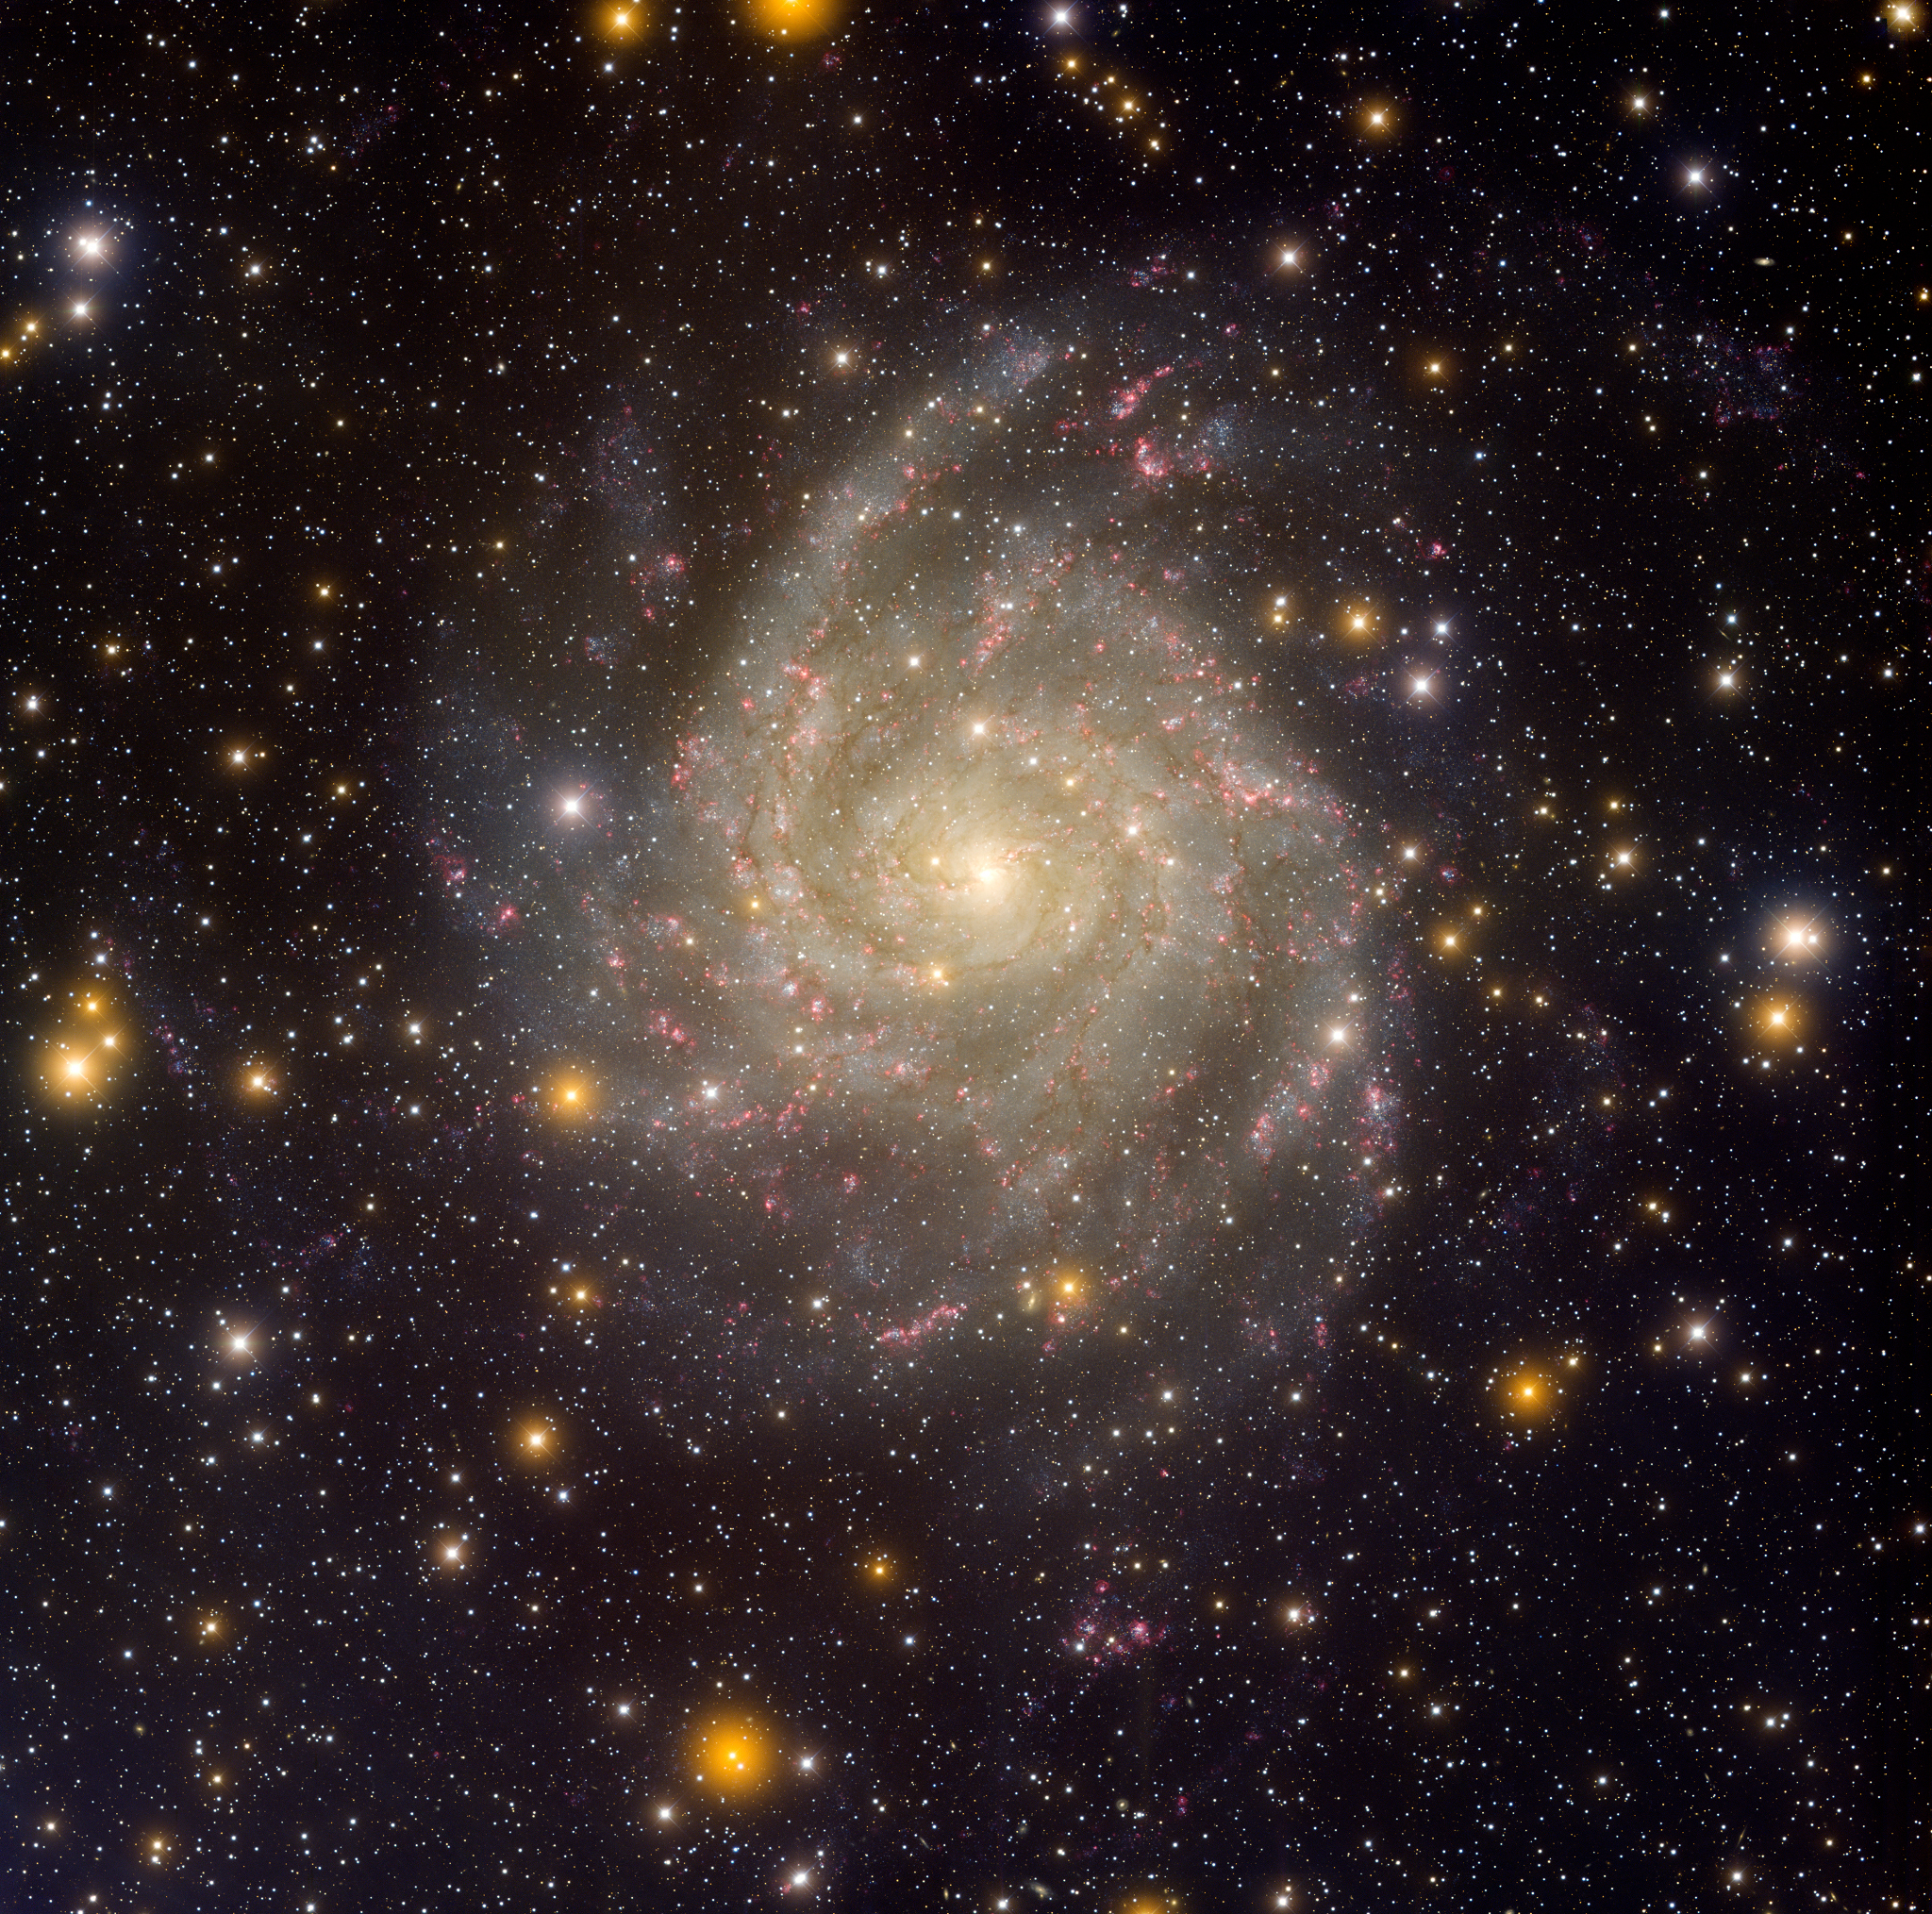
Explanation:Similar in size to large, bright spiral galaxies in our neighborhood, IC 342 is a mere 10 million light-years distant in the long-necked, northern constellation Camelopardalis. A sprawling island universe, IC 342 would otherwise be a prominent galaxy in our night sky, but it is hidden from clear view and only glimpsed through the veil of stars, gas and dust clouds along the plane of our own Milky Way galaxy. Even though IC 342's light is dimmed by intervening cosmic clouds, this sharp telescopic image traces the galaxy's own obscuring dust, blue star clusters, and glowing pink star forming regions along spiral arms that wind far from the galaxy's core. IC 342 may have undergone a recent burst of star formation activity and is close enough to have gravitationally influenced the evolution of the local group of galaxies and the Milky Way.
Welcome back to Messier Monday! In our ongoing tribute to the great Tammy Plotner, we take a look at Orion’s Nebula’s “little brother”, the De Marian’s Nebula!
During the 18th century, famed French astronomer Charles Messier noted the presence of several “nebulous objects” in the night sky. Having originally mistaken them for comets, he began compiling a list of them so that others would not make the same mistake he did. In time, this list (known as the Messier Catalog) would come to include 100 of the most fabulous objects in the night sky.
One of these objects is the open star cluster known as Messier 47 (NGC 2422), which is located in the constellation of Puppis roughly 1,600 light-years from Earth. Located in proximity to Messier 46, this star cluster is estimated to be 78 million years in age. It is also particularly bright, containing about 50 stars and occupying a region that is about the same size as that of the full Moon.
Description:
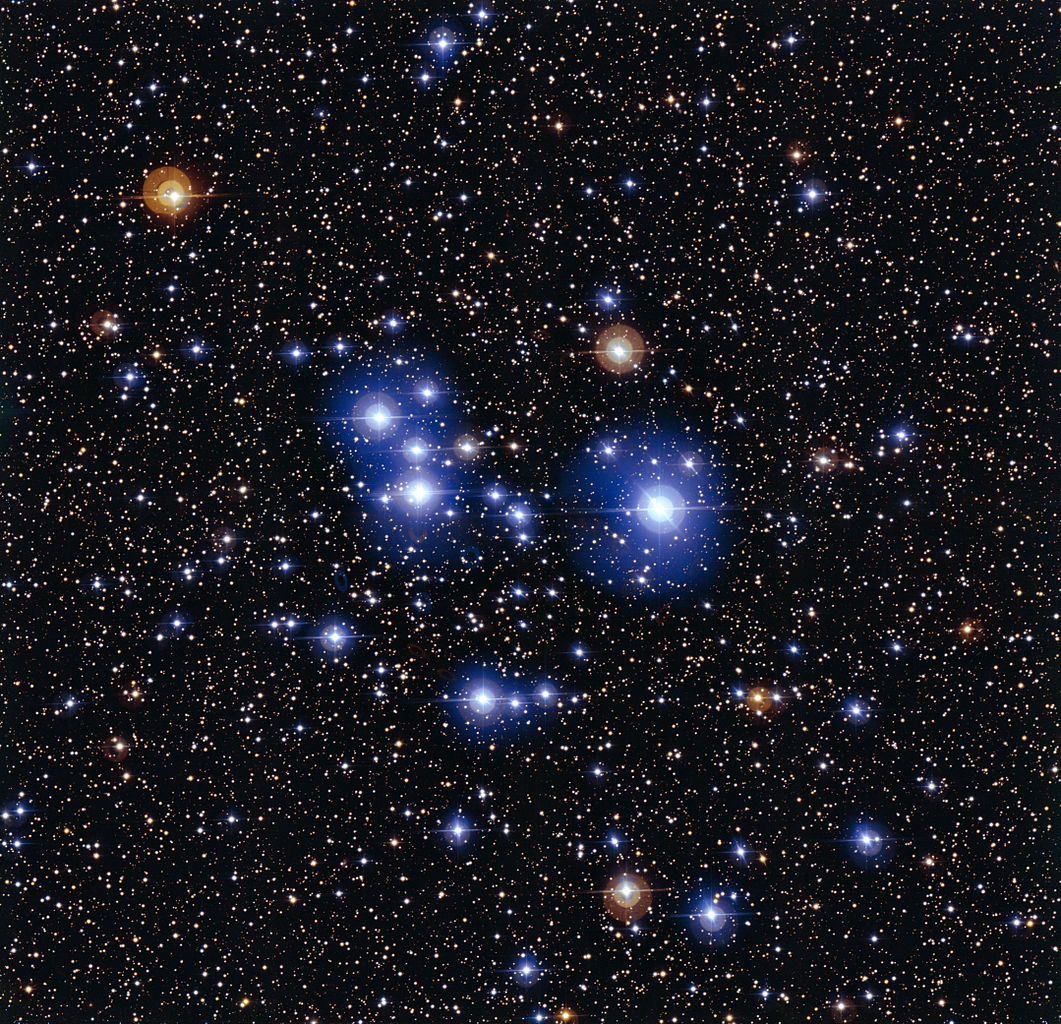
Spanning across about 12 light years of space, this clump of around 50 stars began their life around 78 million years ago. Now cruising through space some 1600 light years away from Earth, the group continues to distance itself from our solar system at a speed of 9 kilometers per second. For the most part, Messier 47 is a whole lot like the Pleiades star cluster – its brightest member shining just around magnitude 6 and holding a spectral class B2.
But, here you will also find two orange K giants with luminosity of about 200 times that of the Sun. At M47’s center you’ll find binary star, Sigma 1121, with components of magnitude 7.9 both and separated by 7.4 arc seconds. How do we know that M47 is a lot like the Pleiades? Let’s try X-ray sources and the advances of looking at open clusters far more differently than in optical wavelengths. As M. Barbera (et al) said in a 2002 study:
“We present the results of a ROSAT study of NGC 2422, a southern open cluster at a distance of about 470 pc, with an age close to the Pleiades. Source detection was performed on two observations, a 10-ks PSPC and a 40-ks HRI pointing, with a detection algorithm based on wavelet transforms, particularly suited to detecting faint sources in crowded fields. We have detected 78 sources, 13 of which were detected only with the HRI, and 37 detected only with the PSPC. For each source, we have computed the 0.2-2.0 keV X-ray flux. Using optical data from the literature and our own low-dispersion spectroscopic observations, we find candidate optical counterparts for 62 X-ray sources, with more than 80% of these counterparts being late type stars. The number of sources (38 of 62) with high membership probability counterparts is consistent with that expected for Galactic plane observations at our sensitivity. We have computed maximum likelihood X-ray luminosity functions (XLF) for F and early-G type stars with high membership probability. Heavy data censoring due to our limited sensitivity permits determination of only the high-luminosity tails of the XLFs; the distributions are indistinguishable from those of the nearly coeval Pleiades cluster.”
What else might be hiding inside Messier 47? Try new debris disk candidates. As Nadya Gorlova (et al) indicated in a 2004 study:
“Sixty-three members of the 100 Myr old open cluster M47 (NGC 2422) have been detected with the Spitzer Space Telescope. The Be star V 378 Pup shows an excess both in the near-infrared, probably due to free-free emission from the gaseous envelope. Seven other early-type stars show smaller excesses. Among late-type stars, two show large excesses. P1121 is the first known main-sequence star showing an excess comparable to that of Beta Pic, which may indicate the presence of an exceptionally massive debris disk. It is possible that a major planetesimal collision has occurred in this system, consistent with the few hundred Myr timescales estimated for the clearing of the solar system.”
Iof the star cluster Messier 47 taken by the Wide Field Imager camera on the 2.2-metre telescope at ESO’s La Silla Observatory in Chile. Credit: ESO
History of Observation:
Messier 47 was originally discovered before 1654 by Hodierna who described it as:
“[A] Nebulosa between the two dogs”… but it was an observation that wasn’t known about until long after Charles Messier independently recovered it on February 19, 1771. “Cluster of stars, little distant from the preceding; the stars are greater; the middle of the cluster was compared with the same star, 2 Navis. The cluster contains no nebulosity.”
However, it was one of those very rare circumstances when Messier actually made a mistake in his position calculations. Despite this error, the cluster was observed by Caroline Herschel and identified as M47 at least twice in early 1783.
As a consequence of Messier’s position mistake, Sir William Herschel also independently rediscovered it on February 4, 1785, and gave it the number H VIII.38. “A cluster of pretty compressed large [bright] and small [faint] stars. Round. Above [more than] 15′ diameter.” It would be John Herschel, on December 16, 1827, who would be the first to resolve Sigma 1121: “The chief star of a large, pretty rich, straggling cluster. It [the star] is double.”
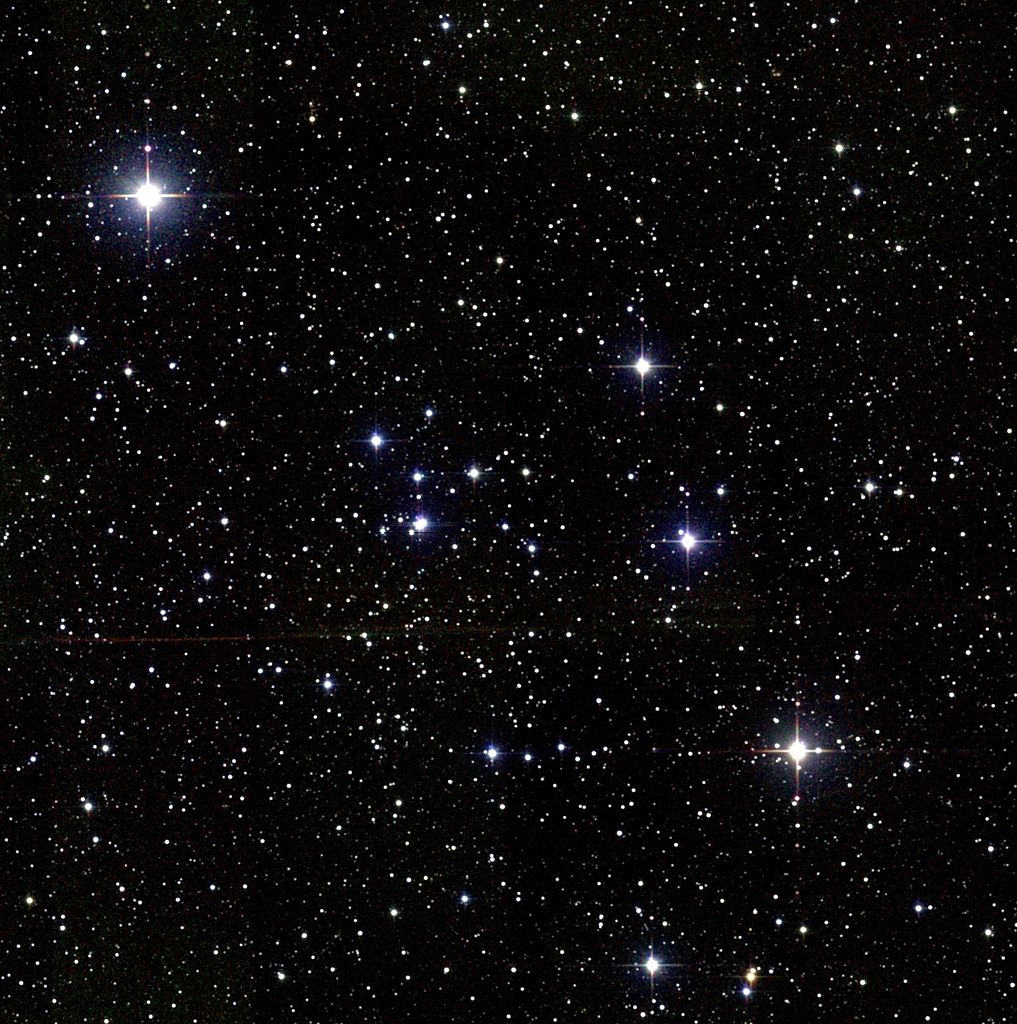
Atlas Image mosaic obtained of Messier 47 as part of the Two Micron All Sky Survey (2MASS). Credit: UMass/IPAC/Caltech/NASA/NSF
The “Messy” mistake would haunt star catalogs – including both Herschel’s and Dreyer’s for years, until the whole clerical error was cleared up by Owen Gingerich in 1960:
“More explicit reasons for this identification [of M47 with NGC 2422] were given independently in 1959 by T.F. Morris, a member of the Messier Club of the Royal Astronomical Society of Canada’s Montreal Centre. Dr. Morris suggested that an error in signs in the difference between M47 and the comparison star could account for the position. Messier determined the declination of a nebula or cluster by measuring the difference between the object and a comparison star of known declination. The right ascension could be found by recording the times at which the object and the star drifted across a central wire in his telescope’s field; the time interval gives the difference in right ascension. The differences between Messier’s 1770 [actually 1771] position for M47 and his stated comparison star, 2 Navis (now 2 Puppis), if applied with opposite signs, leads to NGC 2422. Clearly, Messier made a mistake in computation!”
May you have Caroline Herschel’s luck finding it!
Locating Messier 47:
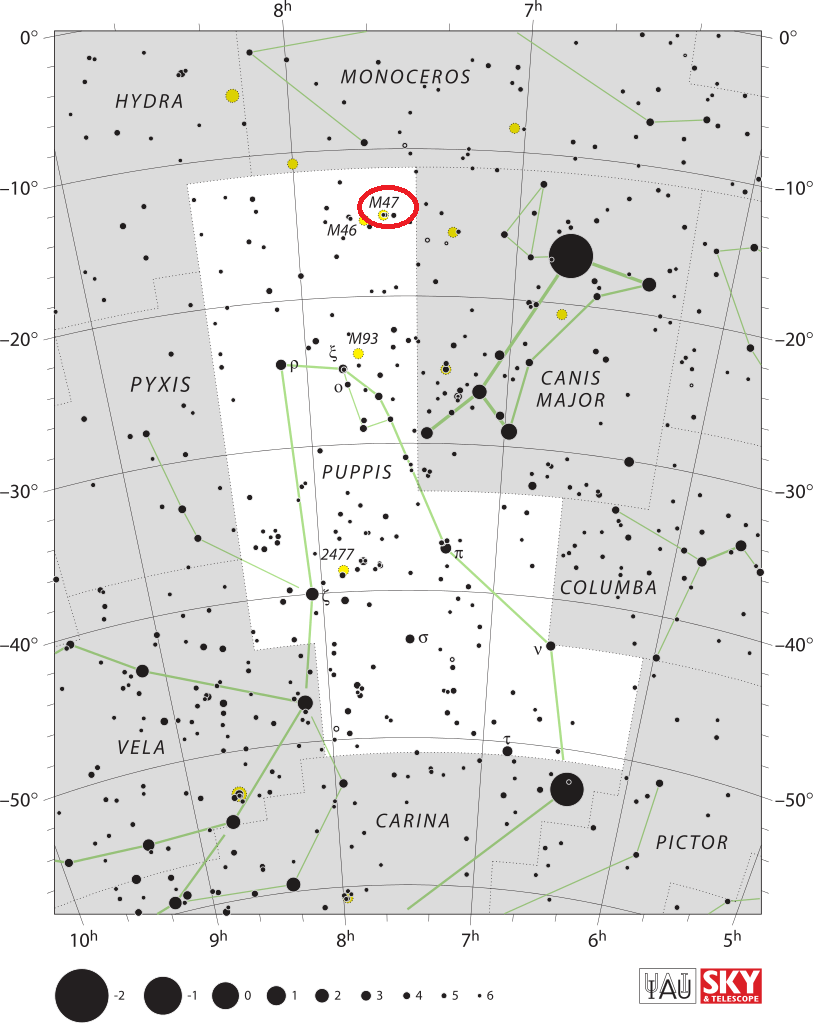
There is no simple way of finding Messier 47 in the finderscope of a telescope, but it’s not too hard with binoculars. Begin your hunt a little more than a fist width east/northeast of bright Sirius (Alpha Canis Majoris)… or about 5 degrees (3 finger widths) south of Alpha Monoceros. (It can sometimes by seen with the unaided eye under good conditions as a dim nebulosity.) There you will find two open clusters that will usually appear in the same average binocular field of view.
Messier 47 location. Image: IAU and Sky & Telescope magazine (Roger Sinnott & Rick Fienberg)
M47 is the westernmost of the pair. It will appear slightly brighter and the stars will be more fewer and more clearly visible. In the finderscope it will appear as if it is resolving, while neighboring eastern M46 will just look like a foggy patch. Because M47’s stars are brighter, it is better suited to less than perfect sky conditions, showing as a compression that begins to resolve in binoculars and will resolves almost fully even a small telescope.
And here are the quick facts on this Messier Object to help you get started:
Object Name: Messier 47 Alternative Designations: M47, NGC 2422 Object Type: Open Galactic Star Cluster Constellation: Puppis Right Ascension: 07 : 36.6 (h:m) Declination: -14 : 30 (deg:m) Distance: 1.6 (kly) Visual Brightness: 5.2 (mag) Apparent Dimension: 30.0 (arc min)
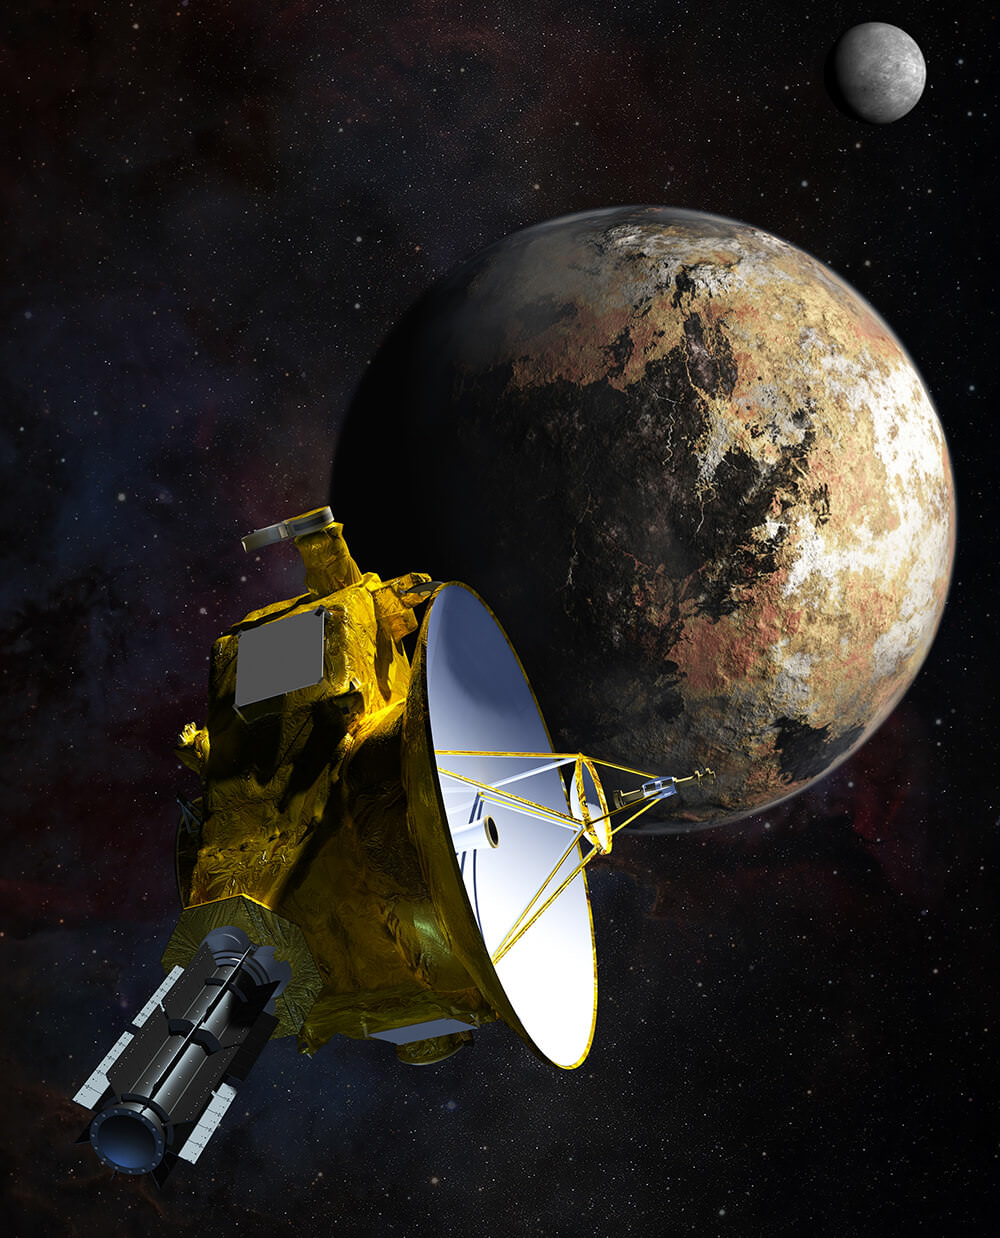
Once held to be the outermost planet of the Solar System, Pluto‘s designation was changed by the International Astronomical Union in 2006, owing to the discovery of many new Kuiper Belt Objects that were comparable in size. In spite of this, Pluto remains a source of fascination and a focal point of much scientific interest. And even after the historic flyby conducted by the New Horizons probe in July of 2015, many mysteries remain.
What’s more, ongoing analysis of the NH data has revealed new mysteries. For instance, a recent study by a team of astronomers indicated that a survey by the Chandra X-ray Observatory revealed the presence of some rather strong x-rays emissions coming from Pluto. This was unexpected, and is causing scientists to rethink what they thought they knew about Pluto’s atmosphere and its interaction with solar wind.
In the past, many Solar bodies have been observed emitting x-rays, which were the result of interaction between solar wind and neutral gases (like argon and nitrogen). Such emissions have been detected from planets like Venus and Mars (due to the presence of argon and/or nitrogen in their atmospheres), but also with smaller bodies like comets – which acquire halos due to outgassing.
Artist’s impression of New Horizons’ close encounter with the Pluto–Charon system. Credit: NASA/JHU APL/SwRI/Steve Gribben
Ever since the NH probe conducted its flyby of Pluto in 2015, astronomers have been aware that Pluto has an atmosphere which changes size and density with the seasons. Basically, as the planet reaches perihelion during its 248 year orbital period – a distance of 4,436,820,000 km, 2,756,912,133 mi from the Sun – the atmosphere thickens due to the sublimation of frozen nitrogen and methane on the surface.
The last time Pluto was at perihelion was on September 5th, 1989, which means that it was still experiencing summer when NH made its flyby. While studying Pluto, the probe detected an atmosphere that was primarily composed of nitrogen gas (N²) along with methane (CH4) and carbon dioxide (CO²). Astronomers therefore decided to look for signs of x-ray emissions coming from Pluto’s atmosphere using the Chandra X-ray Observatory.
Prior to the NH mission’s flyby, most models of Pluto’s atmosphere expected it to be quite extended. However, the probe found that the atmosphere was less extended and that its rate of loss was hundreds of times lower than what these models predicted. Therefore, as the team indicated in their study, they expected to find x-ray emissions that were consistent with what the NH flyby observed:
“Given that most pre-encounter models of Pluto’s atmosphere had predicted it to be much more extended, with an estimated loss rate to space of ~1027 to 1028 mol/sec of N² and CH4… we attempted to detect X-ray emission created by [solar wind] neutral gas charge exchange interactions in the low density neutral gas surrounding Pluto,” they wrote.
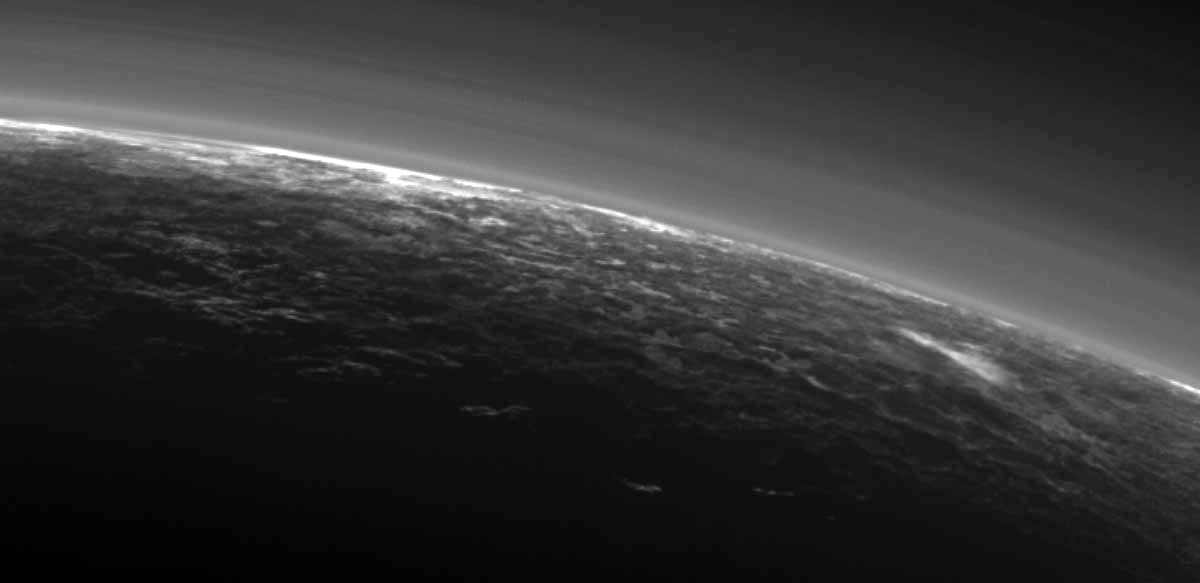
Images sent by NASA’s New Horizons spacecraft show possible clouds floating over the frozen landscape including the streaky patch at right. Credit: NASA/JHUAPL/SwR
However, after consulting data from the Advanced CCD Imaging Spectrometer (ACIS) aboard Chandra, they found that x-ray emissions coming from Pluto were greater than what this would allow for. In some cases, strong x-ray emissions have been noted coming from other smaller objects in the Solar System, which is due to the scattering of solar x-rays by small dust grains composed of carbon, nitrogen and oxygen.
But the energy distribution they noted with Pluto’s x-rays were not consistent with this explanation. Another possibility that the team offered is that they could be due to some process (or processes) that focus the solar wind near Pluto, which would enhance the effect of its modest atmosphere. As they indicate in their conclusions:
“The observed emission from Pluto is not aurorally driven. If due to scattering, it would have to be sourced by a unique population of nanoscale haze grains composed of C, N, and O atoms in Pluto’s atmosphere resonantly fluorescing under the Sun’s insolation. If driven by charge exchange between [solar wind] minor ions and neutral gas species (mainly CH4) escaping from Pluto, then density enhancement and adjustment of the [solar wind] minor ion relative abundance in the interaction region near Pluto is required versus naïve models.”
For the time being, the true cause of these x-ray emissions is likely to remain a mystery. They also highlight the need for more research when it comes to this distant and most massive of Kuiper Belt Objects. Luckily, the data provided by the NH mission is likely to be poured over for decades, revealing new and interesting things about Pluto, the outer Solar System, and how the most distant worlds from our Sun behave.