Spectroscopy: The Key to Humanity’s Future in Space:
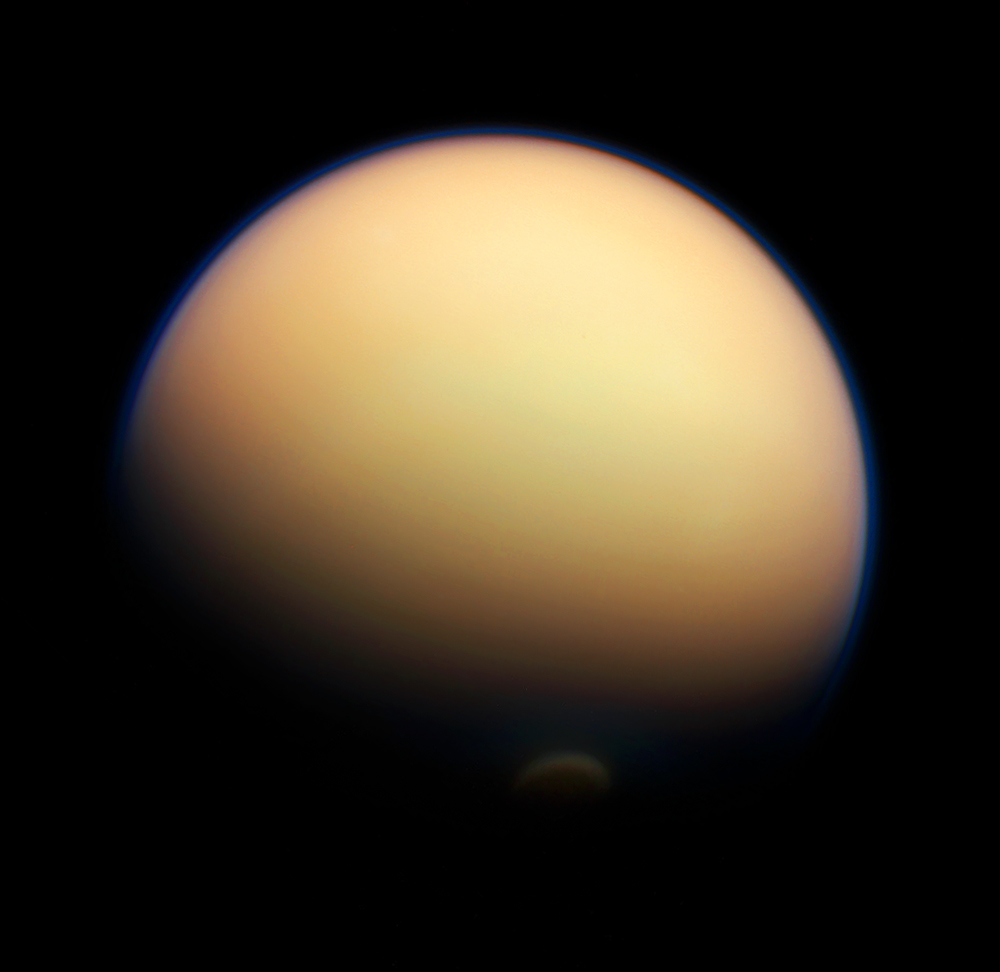
Artistic interpretation of an exoplanet Image Credit: NASA/JPL/CalTECH/IPAC
Imagine, if you would, a potential future for humanity… Imagine massive space-elevators lifting groups of men, women, and children skyward off Earth’s surface. These passengers are then loaded onto shuttles and ferried to the Moon where interstellar starships are docked, waiting to rocket to the stars. These humans are about to begin the greatest journey humanity has ever embarked upon, as they will be the first interstellar colonists to leave our home Solar System in order to begin populating other worlds around alien stars.
There are many things we must tackle first before we can make this type of science-fiction scene a reality. Obviously much faster methods of travel are needed, as well as some sort of incredible material that can serve to anchor the aforementioned space elevators. These are all scientific and engineering questions that humanity will need to overcome in the face of such a journey into the cosmos.
But there is one particular important feature that we can begin to tackle today: where do we point these starships? Towards which system of exoplanets are we to send our brave colonists?
Of all of the amazing things we need to discover or invent to make this scene a reality, discovering which worlds to aim our ships at is something that is actually being worked on today.
Artistic view of a possible space elevator. Image Credit: NASA
It’s an exciting era in astronomy, as astronomers are currently discovering that many of the stars that we view in the night sky have their own planets in orbit around them. Many of them are massive worlds, all orbiting at varying distances from their parent star. It is no surprise that we are discovering a vast majority of these Jupiter-sized worlds first; larger worlds are much easier to detect than the smaller worlds would be. Imagine a bright spotlight pointing at you some 500 yards away (5 football fields). Your job is to detect something the size of a period on this page that is orbiting around it that emits no light of its own. As you can see, the task would be daunting. But nevertheless, our planet hunters have been utilizing methods that enable us to accurately find these tiny specks of gas and rock despite their rather large and luminous companion suns.
However, it is not the method of finding these planets that this article is about; but rather what we do to figure out which of these worlds are worthy of our limited resources and attention. We very well cannot point those starships in random directions and just hope that they happen across an earth-sized planet that has a nitrogen-oxygen rich atmosphere with drinkable water. We need to identify which planets appear to have these mentioned characteristics before we go launching ourselves into the vast universe.
How can we do this? How is it possible that we are able to say with any level of certainty what a planet’s atmosphere is composed of when this planet is so small and so very far away? Spectroscopy is the answer, and it just might be the key to our future in the cosmos.
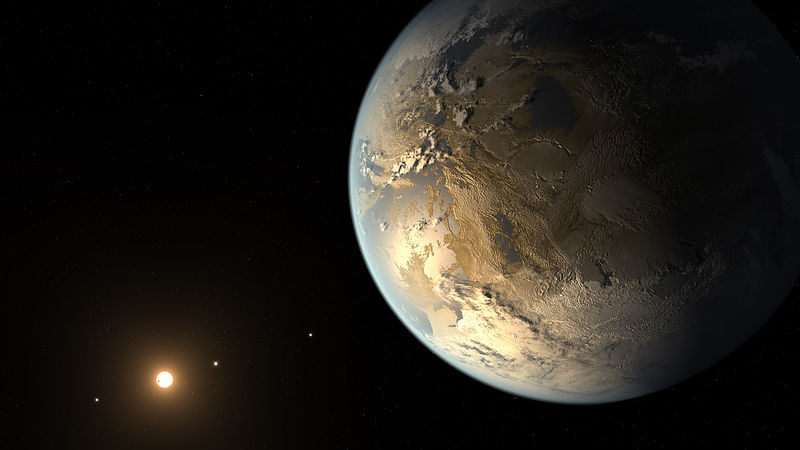
Artistic impression of what Kepler-186f may look like. Image Credit: NASA Ames/SETI Institute/JPL-CalTech
Just so I may illustrate how remarkable our scientific methods are for this very field of research, I will first need to show you the distances we are talking about. Let’s take Kepler 186f. This is the first planet we have discovered that is very similar to Earth. It is around 1.1 times larger than Earth and orbits within the habitable zone of its star which is very similar to our own star.
Let’s do the math, to show you just how distant this planet is. Kepler 186f is around 490 lightyears from Earth.
Kepler 186f = 490 lightyears away
Light moves at 186,282 miles/ 1 second.
186,282 mi/s x 60s/1min x 60min/1hr x 24hrs/1day x 356days/1year =
5.87 x 10¹² mi/yr
Kepler 186f: 490 Lyrs x 5.87 x 10
12miles/ 1 Lyr =
2.88 x 10¹⁵ miles or
2.9 QUADRILLION MILES from Earth.
Just to put this distance into perspective, let’s suppose we utilize the fastest spacecraft we have to get there. The Voyager 1 spacecraft is moving at around 38,500 mi/hr. If we left on that craft today and headed towards this possible future Earth, it would take us roughly
8.5 MILLION YEARS to get there. That’s around 34 times longer than the time between when the first proto-humans began to appear on earth 250,000 years ago until today. So the entire history of human evolution from then till now replayed 34 times BEFORE you would arrive at this planet. Knowing these numbers, how is it even possible that we can know what this planet’s atmosphere, and others like it, are made of?
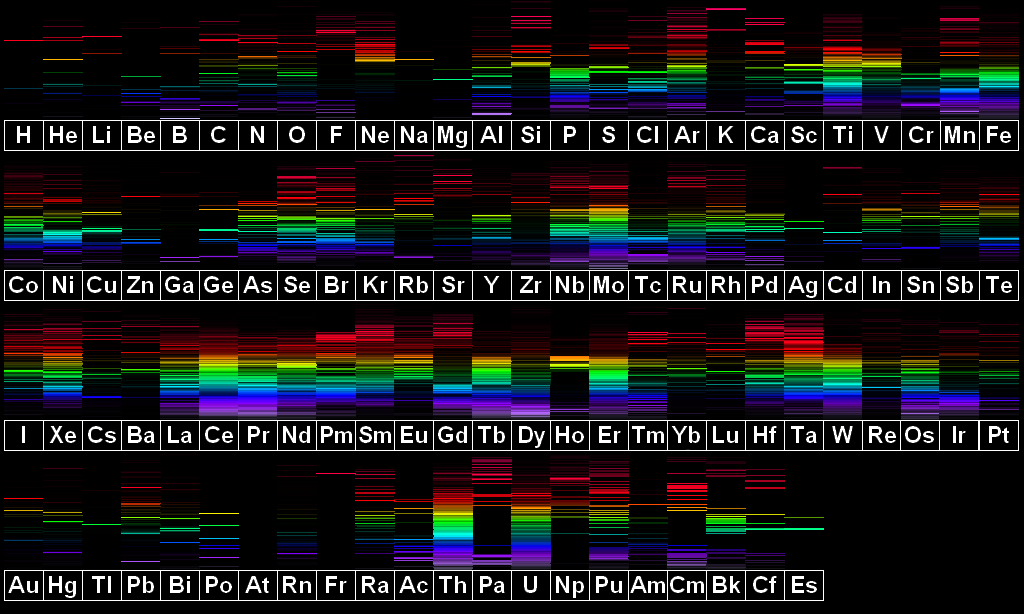
First, here’s a bit of chemistry in order for you to understand the field that is spectroscopy, and then how we apply it to the astronomical sciences. Different elements are composed of a differing number of protons, neutrons, and electrons. These varying numbers are what set the elements apart from one another on the periodic table. It is the electrons, however, that are of particular interest in the majority of what chemistry studies. These different electron configurations allow for what we call spectral signatures to exist among the elements. This means that since every single element has a specific electron configuration, the light that it both absorbs and emits acts as a sort of photon fingerprint; a unique identifier to that element.
A list of the elements with their corresponding visible light emission spectra. Image Credit: MIT Wavelength Tables, NIST Atomic Spectrum Database, umop.net
The standard equation for determining the characteristics of light is:
c=
v λ
c is the speed of light in a vacuum (3.00 x 10
8 m/s)
v is the frequency of the light wave (in Hertz)
λ (lambda) represents the wavelength (in meters, but will usually be converted to nanometers) which will determine what color of light will be emitted from the element(s), or simply where the wavelength of light falls on the electromagnetic spectrum (infrared, visible, ultraviolet, etc.)
If you have either the frequency or the wavelength, you can determine the rest. You can even start with the energy of the light being detected by your instruments and then work backwards with the following equations:
The energy of a photon can be described mathematically as this:
Ephoton =
h vOR
Ephoton =
h c / λ
What these mean is that the energy of a photon is the product of the frequency (
v) of the light wave emitted multiplied by Planck’s Constant (
h), which is 6.63 x 10
-34 Joules x seconds. Or in the case of the second equation, the energy of the photon is equal to Planck’s Constant x the speed of light divided by the wavelength. This will give you the amount of energy that a specific wavelength of light contains. This equation is also known as the Planck-Einstein Relation. So, if you take a measurement and you are given a specific energy reading of the light coming from a distant star, you can then deduce what information you need about said light and determine which element(s) are either emitting or absorbing these wavelengths. It’s all mathematical detective work.
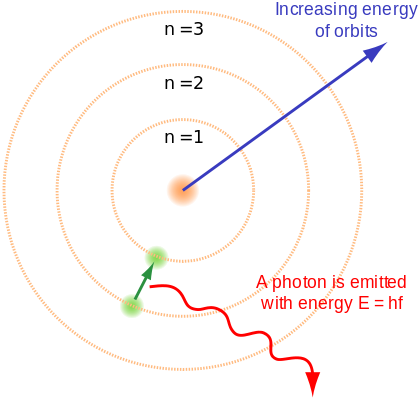
So, the electrons that orbit around the nucleus of atoms exist in what we call orbitals. Depending on the atom (and the electrons associated with it), there are many different orbitals. You have the “ground” orbital for the electron, which means that the electron(s) there are closest to the nucleus. They are “non-excited”. However, there are “higher” quantum orbitals that exist that the electron(s) can “jump” to when the atom is excited. Each orbital can have different quantum number values associated with it. The main value we will use is the Principle Quantum Number. This is denoted by the letter “n”, and has an assigned integer value of 1, 2, 3, etc. The higher the number, the further from the nucleus the electron resides, and the more energy is associated with it. This is best described with an example:
A hydrogen atom has 1 electron. That electron is whipping around its 1 proton nucleus in its ground state orbital. Suddenly, a burst of high energy light hits the hydrogen. This energy is transferred throughout the hydrogen atom, and the electron reacts. The electron will instantaneously “vanish” from the n1 orbital and then reappear on a higher quantum orbital (say n4). This means that as that light wave passed over this hydrogen atom, a specific wavelength was absorbed by the hydrogen (this is an important feature to remember for later).
Diagram of an electron dropping from a higher orbital to a lower one and emitting a photon. Image Credit: Wikimedia Commons
Eventually, the “excited” electron will drop from its higher quantum orbital (n4) back down to the n1 orbital. When this happens, a specific wavelength of light is emitted by the hydrogen atom. When the electron “drops”, it emits a photon of specific energy or wavelength (dependent upon many factors, including the state the electron was in prior to its “excitement”, the amount of levels the electron dropped, etc.) We can then measure this energy (or wavelength, or frequency,) to determine what element the photon is coming from (in this case, hydrogen). It is in this feature that each element has its own light signature. Each atom can absorb and emit specific wavelengths of light, and they are all tied together by the equations listed above.
So how does this all work? Well, in reality, there are many factors that go into this sort of astronomical study. I am simply describing the basic principle behind the work. I say this so that the many scientists that are doing this sort of work do not feel as though I have discredited their research and hard work; I promise you, it is painstakingly difficult and tedious and involves many more details that I am not mentioning here. That being said, the basic concept works like this:
We find a star that gives off the telltale signs that it has a planet orbiting around it. We do this with a few methods, but how it all first started was by detecting a “wobble” in the star’s apparent position. This “wobble” is caused by a planet orbiting around its parent star. You see, when a planet orbits a star (and when anything orbits anything else), the planet isn’t really orbiting the star, the planet AND the star are orbiting a common focal point. Usually with this type of orbital system, that common focal point is fairly close to the center of the star, and thus it’s safe to say that the planet orbits the star. However, this causes the star to move ever so slightly. We can measure this.
Once we determine that there are planets orbiting the star in question, we can study it more closely. When we do, we turn our instruments towards it and begin taking highly detailed measurements, and then we wait. What we are waiting for is a dimming of the star at a regular interval. What we are hoping for is this newly-found exoplanet to transit our selected star. When a planet transits a star, it moves in front of the star relative to us (this also means we are incredibly lucky, as not all planets will orbit “in front” of the star relative to our view). This will cause the star’s brightness to dip ever so slightly at a regular interval. Now we have identified a prime exoplanet candidate for study.

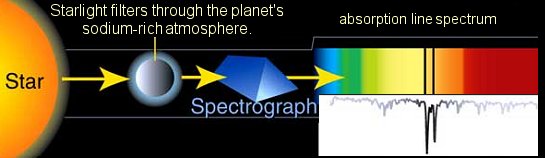
Diagram of how we can use absorption spectral reading to determine the atmosphere of an exoplanet. Image Credit: A. Feild, STScl, NASA
We can now introduce the spectroscopic principles to this hunt. We can take all sorts of measurements of the light that is coming from this star. Its brightness, the energy it’s kicking out per second, and even what that star is made of (the emission spectrum I discussed earlier). Then what we do is wait for the planet to transit the start, and begin taking readings. What we are doing is reading the light passing THROUGH the exoplanet’s atmosphere, and then studying what we can call an Absorption Spectrum reading. As I mentioned earlier, specific elements will absorb specific wavelengths of light. What we get back is a spectral reading of the star’s light signature (the emission spectra of the star), but with missing wavelengths that show up as very tiny black lines where there used to be color. These are called Fraunhofer lines, named after the “father” of astrophysics Joseph Fraunhofer, who discovered these lines in the 19
th century.
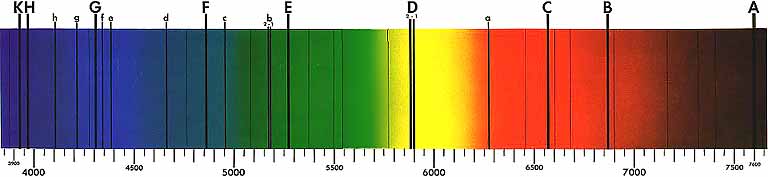
The dark lines represent the light frequencies that were absorbed by specific chemicals that this particular light passed through. Image Credit: Wikimedia Commons
What we now have in our possession is a chemical fingerprint of what this exoplanet’s atmosphere is composed of. The star’s spectrum is splayed out before us, but the barcode of the planet’s atmospheric composition lay within the light. We can then take those wavelengths that are missing and compare them to the already established absorption/emission spectra of all of the known elements. In this way, we can begin to piece together what this planet has to offer us. If we get high readings of sulfur and hydrogen, we have probably just discovered a gas giant. However if we discover a good amount of nitrogen and oxygen, we may have found a world that has liquid water on its surface (provided that this planet resides within its host star’s “habitable” zone: a distance that is just far enough from the star to allow for liquid water). If we find a planet that has carbon dioxide in its atmosphere, we may just have discovered alien life (CO
2 being a waste product of both cellular respiration and a lot of industrial processes, but it can also be a product of volcanism and other non-organic phenomena).
What this all means is that by being able to read the light from any given object, we can narrow our search for the next Earth. Regardless of distance, if we can obtain an accurate measurement of the light moving through an exoplanet’s atmosphere, we can tell what it is made of.
We have discovered some 2000 exoplanets thus far, and that number will only increase in the coming decades. With so many candidates, it will be a wonder if we do not find a planet that we humans can live on without the help of technology. Obviously our techniques will further be refined, and as new technologies, methods, and instruments become available, our ability to pinpoint planets that we can someday colonize will become increasingly more accurate.
With such telescopes like the James Webb Space Telescope launching soon, we will be able to image these exoplanets and get even better spectroscopic readings from them. This type of science is on the leading edge of humanity’s journey into the cosmos. Astrophysicists and astrochemists that work in this field are the necessary precursors to the brave men and women who will one day board those interstellar spacecraft and launch our civilization into the Universe to truly become an interstellar species.
Possible glimpse into our future… Image Credit: Battlestar Wiki Media

I am currently an aspiring student of science. I will be working towards my undergraduate degree in Earth and Space Physics with a Minor in Astronomy. My future goals are to complete a Masters and then a Ph.D in Astrophysics. As well as studying the astro-sciences, I am also a three-time combat vet. Having completed my service, I now seek to advance the public's knowledge on astronomical phenomena.


 That's the case with NGC 2207 and IC 2163, which are located about 130 million light-years from Earth, in the constellation of Canis Major. Image credit: NASA/CXC/SAO/STScI/JPL-Caltech
 This view of Earth comes from NASA's Moderate Resolution Imaging Spectroradiometer aboard the Terra satellite.


