Wednesday, December 3, 2014

The “Potsdam Gravity Potato” Shows Variations in Earth’s Gravity

The “Potsdam Gravity Potato” Shows Variations in Earth’s Gravity:


The Geoid 2011 model, based on data from LAGEOS, GRACE, GOCE and surface data. Credit: GFZ


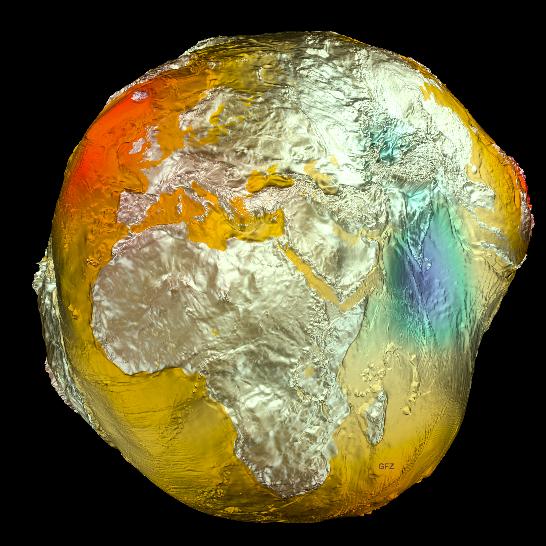
The Earth’s gravitational model (aka the “Potsdam Potato”) is based on data from the LAGEOS, GRACE, and GOCE satellites and surface data. Credit: GFZ
People tend to think of gravity here on Earth as a uniform and consistent thing. Stand anywhere on the globe, at any time of year, and you’ll feel the same downward pull of a single G. But in fact, Earth’s gravitational field is subject to variations that occur over time. This is due to a combination of factors, such as the uneven distributions of mass in the oceans, continents, and deep interior, as well as climate-related variables like the water balance of continents, and the melting or growing of glaciers.

And now, for the first time ever, these variations have been captured in the image known as the “Potsdam Gravity Potato” –  a visualization of the Earth’s gravity field model produced by the German Research Center for Geophysics’ (GFZ) Helmholtz’s Center in Potsdam, Germany.

And as you can see from the image above, it bears a striking resemblance to a potato. But what is more striking is the fact that through these models, the Earth’s gravitational field is depicted not as a solid body, but as a dynamic surface that varies over time.This new gravity field model (which is designated EIGEN-6C) was made using measurements obtained from the LAGEOS, GRACE, and GOCE satellites, as well as ground-based gravity measurements and data from the satellite altimetry.


The Geoid 2005 model, which was based on data of two satellites (CHAMP and GRACE) plus surface data. Credit: GFZ


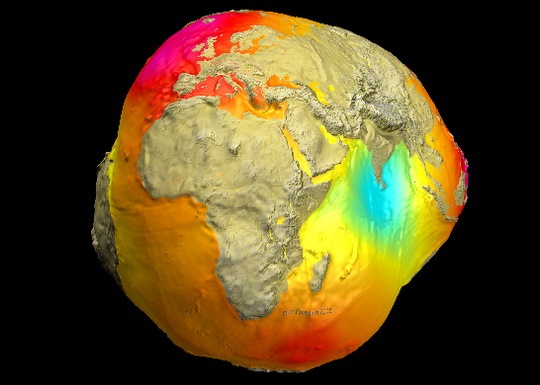
The 2005 model, which was based on data from the CHAMP and GRACE satellites and surface data, was less refined than the latest one. Credit: GFZ
Compared to the previous model obtained in 2005 (shown above), EIGEN-6C has a fourfold increase in spatial resolution.

“Of particular importance is the inclusion of measurements from the satellite GOCE, from which the GFZ did its own calculation of the gravitational field,” says Dr. Christoph Foerste who directs the gravity field work group at GFZ along with Dr. Frank Flechtner.

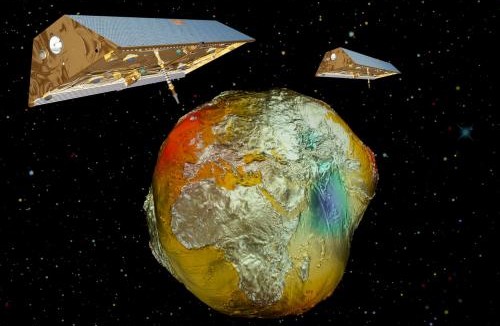
The ESA mission GOCE (Gravity Field and Steady-State Ocean Circulation Explorer) was launched in mid-March 2009 and has since been measuring the Earth’s gravitational field using satellite gradiometry – the study and measurement of variations in the acceleration due to gravity.

“This allows the measurement of gravity in inaccessible regions with unprecedented accuracy, for example in Central Africa and the Himalayas,” said Dr. Flechtner. In addition, the GOCE satellites offers advantages when it comes to measuring the oceans.

Within the many open spaces that lie under the sea, the Earth’s gravity field shows variations. GOCE is able to better map these, as well as deviations in the ocean’s surface – a factor known as “dynamic ocean topography” – which is a result of Earth’s gravity affecting the ocean’s surface equilibrium.


Twin-satellites GRACE with the earth's gravity field (vertically enhanceded) calculated from CHAMP data. Credit: GFZ


Twin-satellites GRACE with the earth’s gravity field (vertically enhanced) calculated from CHAMP data. Credit: GFZ
Long-term measurement data from the GFZ’s twin-satellite mission GRACE (Gravity Recovery And Climate Experiment) were also included in the model. By monitoring climate-based variables like the melting of large glaciers in the polar regions and the amount of seasonal water stored in large river systems, GRACE was able to determine the influence of large-scale temporal changes on the gravitational field.

Given the temporal nature of climate-related processes – not to mention the role played by Climate Change – ongoing missions are needed to see how they effect our planet long-term. Especially since the GRACE mission is scheduled to end in 2015.

In total, some 800 million observations went into the computation of the final model which is composed of more than 75,000 parameters representing the global gravitational field. The GOCE satellite alone made 27,000 orbits during its period of service (between March 2009 and November 2013) in order to collect data on the variations in the Earth’s gravitational field.

The final result achieved centimeter accuracy, and can serve as a global reference for sea levels and heights. Beyond the “gravity community,” the research has also piqued the interest of researchers in aerospace engineering, atmospheric sciences, and space debris.

But above all else, it offers scientists a way of imaging the world that is different from, but still complimentary to, approaches based on light, magnetism, and seismic waves. And it could be used for everything from determining the speed of ocean currents from space, monitoring rising sea levels and melting ice sheets, to uncovering hidden features of continental geology and even peeking at the convection force driving plate tectonics.

Further Reading: GFZ


About 

Author, freelance writer, educator, Taekwon-Do instructor, and loving hubby, son and Island boy!

Sail Past Orion to the Outer Limits of the Milky Way

Sail Past Orion to the Outer Limits of the Milky Way:


Orion (at right), Sirius (bottom) and the pale wintertime Milky Way (center) are well-placed for viewing around 11 o'clock local time in late November. Credit: Bob King


Orion (at right), Sirius (bottom) along with the pale band of the wintertime Milky Way  are well-placed for viewing around 11 o’clock local time in late November. Credit: Bob King
Several nights ago the chill of interstellar space refrigerated the countryside as temperatures fell well below zero. That didn’t discourage the likes of Orion and his seasonal friends Gemini, Perseus and Auriga. They only seemed to grow brighter as the air grew sharper.

Wending between these familiar constellations like a river steaming in the cold was the Milky Way. The name has always been slightly confusing as it refers to both the milky band of starlight and the galaxy itself.  Every single star you see at night belongs to our galaxy, a 100,000 light-year-wide flattened disk scintillating with over 400 billion suns.


Our solar system lies in the flat plane of a barred spiral galaxy called the Milky Way. Looking through the plane, the stars pile up to form the Milky Way band. In summerr, we face toward the richer, denser core; in winter we look out toward the edge. Credit: NASA with annotations by the author


Face-on (left) and edge-on views of the Milky Way. Our solar system lies in the flat plane of a barred spiral galaxy called the Milky Way. Looking through the plane, the stars pile up to form the Milky Way band. In summer, we face toward the richer, denser core; in winter we look out toward the edge. Credit: NASA with annotations by the author
Earth, Sun and planets huddle together within the mid-plane of the disk, so that when we look straight into it, the density of stars piles up over thousands of light years to form a thick band across the sky. Since most of the stars are very distant and therefore faint, they can’t be seen individually with the naked eye. They blend together to give the Milky Way a milky or hazy look.


During a snowfall, we can see individual flakes nearby but more distant ones increase in number and blend into a uniform haze. Credit: Bob King


During a snowfall, we can see individual flakes nearby but more distant ones increase in number and blend to make a uniform haze similar to what happens when we look across the flat disk of the Milky Way. Credit: Bob King
In a snowstorm, we easily distinguish individual snowflakes falling in front of our face, but looking into the distance, the flakes blend together to create a white, foggy haze. Replace the snowflakes with stars and you have the Milky Way – with a caveat. If we lived in the center of our galaxy, the sky would be milky with stars in all directions just like that snowstorm, but since the Sun occupies the flat plane, they only appear thick when our line of sight is aimed along the galaxy’s equator. Look above and below the disk and the stars quickly thin out as our gaze pierces through the galaxy’s plane and into intergalactic space.


In this view, the ground is literally gone and we can see all around us in space. From this perspective we can see the full circle of the Milky Way. The blue line represents the galactic equator. Time is around midnight December 1st. Notice that the Sun is located in the same direction as the galaxy's center this month. Stellarium


In this view, the ground – Earth – has been removed from the picture and we can see all around us in space. Now we can see that the Milky Way band describes a full circle in the sky. The blue circle represents the galactic equator. The view shows the sky around midnight in early December. The Sun, at lower right, lies in the same direction as the galaxy’s center this month. Source: Stellarium
If you could float in space some distance from the brilliant ball of Earth, you’d see that the Milky Way band passes above, around and below you like a giant hula-hoop. Back on the ground, we can only see about two-thirds of the band over the course of a year. The other third is below the horizon and visible only from the opposite hemisphere, providing yet another good reason to make that trip to Tahiti or Ayers Rock in Australia.

Few know the winter version of the Milky Way that stands above the southeastern horizon around 10:30-11 p.m. local time on moonless nights in early December. No surprise, given it hardly compares to the brightness of the summertime version. This has much to do with where the Sun is located inside the galaxy, some 30,000 light years away from the center or more than halfway to the edge.


The opposite of the galaxy's center is the anticenter, located near El Nath in the northern horn of Taurus above the constellation Orion. Source: Stellarium


Opposite the galaxy’s center lies the anticenter, located near El Nath in the northern horn of Taurus above the constellation Orion. Source: Stellarium
On late fall and winter nights, our planet faces the galaxy’s outer suburbs and countryside where the stars thin out until giving way to relatively starless intergalactic space. Indeed, the anticenter of the Milky Way lies not far from the star El Nath (Beta Tauri) where Taurus meets Auriga. While the hazy band of the Milky Way is still visible through Auriga and Taurus, it’s thin and anemic compared to summer’s billowy star clouds.


The summertime Milky Way from Scorpius to Cygnus is broader and brighter than the winter version because we look into the direction of its center. Credit: Stephen Bockhold


The summertime Milky Way from Scorpius to Cygnus is broader and brighter than the winter version because we face toward the galactic center at nightfall. Credit: Stephen Bockhold
At nightfall in July and August, we face toward the galaxy’s center where 30,000 light years worth of stars, star clouds and nebulae stack up to fatten the Milky Way into a bright, chunky arch on summer evenings compared to winter’s thin gruel.


The slanting winter Milky Way touches many of the familiar, bright constellations of the December sky. This map shows the sky facing southeast around 11 o'clock local time in early December or 9 p.m. in late December. Source: Stellarium


The slanting winter Milky Way touches many of the familiar, bright constellations of December. This map shows the sky facing southeast around 11 o’clock local time in early December or 9 p.m. in late December. Source: Stellarium
The winter Milky Way starts east of brilliant Sirius and grazes the east side of Orion before ascending into Gemini and Auriga and arching over into the western sky to Cassiopeia’s “W”. Binoculars and telescopes resolve it into individual stars and star clusters and help us appreciate what a truly beautiful and rich place our galactic home is.

Few sights that impress us with the scope and scale of where we live than seeing the Milky Way under a dark sky during the silence of a winter night. Picture Earth and yourself as members of that glowing carpet of  stars, and when you can’t take the cold anymore, enjoy the delicious pleasure of stepping inside to unwrap and warm up. You’ve been on a long journey.


About 

I'm a long-time amateur astronomer and member of the American Association of Variable Star Observers (AAVSO). My observing passions include everything from auroras to Z Cam stars. Every day the universe offers up something both beautiful and thought-provoking. I also write a daily astronomy blog called Astro Bob.

Probing Pluto’s Paltry Atmosphere Using A Solar Eclipse And Spacecraft

Probing Pluto’s Paltry Atmosphere Using A Solar Eclipse And Spacecraft:


Artist's conception of the Pluto system from the surface of one of its moons. Credit: NASA, ESA and G. Bacon (STScI)


Artist’s conception of the Pluto system from the surface of one of its moons. Credit: NASA, ESA and G. Bacon (STScI)
Pluto is so far away from us and so tiny that it’s hard to glean even basic facts about it. What is its tenuous atmosphere made of? And how to observe it during NASA’s New Horizons very brief flyby next July? A recent Johns Hopkins blog post explains how a careful maneuver post-Pluto will let investigators use the Sun to examine the dwarf planet’s true nature.

Investigators will use an instrument called Alice, an ultraviolet spectrometer, to look at the atmosphere around Pluto and its largest moon, Charon. Alice is capable of examining the gases in the atmosphere using a large “airglow” aperture (4 by 4 centimeters) and also using the Sun for observation with a smaller, 1-mm solar occultation channel.

“Once New Horizons flies past Pluto, the trajectory will conveniently (meaning, carefully planned for many years) fly the spacecraft through Pluto’s shadow, creating an effect just like a solar eclipse here on Earth,” wrote Joel Parker, New Horizons co-investigator, in a blog post.


New Horizons


New Horizons spacecraft. Image Credit: NASA
“So we can (and will) just turn the spacecraft around and stare at the Sun, using Alice as it goes behind Pluto to measure how the Sun’s ultraviolet light changes as that light passes through deeper and deeper parts of Pluto’s atmosphere. This technique lets us measure the composition of Pluto’s atmosphere as a function of altitude.”

And guess where the technique was used not too long ago? Titan! That’s a moon of Saturn full of hydrocarbons and what could be a precursor chemistry to life. The moon is completely socked in with this orange haze that is intriguing. Scientists are still trying to figure out what it is made of — and also, to use our understanding of it to apply to planets outside our solar system.

When a huge exoplanet passes in front of its star, and it’s close enough to Earth, scientists are starting to learn how to ferret out information about its chemistry. This shows them what temperature the atmosphere is like and what it is made of, although it should be emphasized scientists are only starting on this work.


A composite image of Titan's atmosphere, created using blue, green and red spectral filters to create an enhanced-color view. Image Credit: NASA/JPL/Space Science Institute


A composite image of Titan’s atmosphere, created using blue, green and red spectral filters to create an enhanced-color view. Image Credit: NASA/JPL/Space Science Institute
The goal of performing these transit observations of Titan was to understand how haze on an exoplanet might blur the observations. From four passes with the Cassini spacecraft, the team (led by Tyler Robinson at NASA’s Ames Research Center) found that haze would make it difficult to get information from all but the upper atmosphere.

“An additional finding from the study is that Titan’s hazes more strongly affect shorter wavelengths, or bluer, colors of light,” NASA stated at the time. “Studies of exoplanet spectra have commonly assumed that hazes would affect all colors of light in similar ways. Studying sunsets through Titan’s hazes has revealed that this is not the case.”

The nature of Pluto will better come to light when New Horizons makes its pass by the planet in July 2015. Meanwhile, controllers are counting down the days until the spacecraft emerges from its last hibernation on Saturday (Dec. 6).

Source: Johns Hopkins Applied Physics Laboratory


About 

Elizabeth Howell is the senior writer at Universe Today. She also works for Space.com, Space Exploration Network, the NASA Lunar Science Institute, NASA Astrobiology Magazine and LiveScience, among others. Career highlights include watching three shuttle launches, and going on a two-week simulated Mars expedition in rural Utah. You can follow her on Twitter @howellspace or contact her at her website.

Dawn Spacecraft Will Take Pictures Of Its Target Asteroid Today

Dawn Spacecraft Will Take Pictures Of Its Target Asteroid Today:


Artist's conception of the Dawn spacecraft approaching the asteroid Ceres. Credit: NASA/JPL-Caltech


Artist’s conception of the Dawn spacecraft approaching the dwarf planet Ceres. Credit: NASA/JPL-Caltech
The year 2015 is going to be a big one for far-off spacecraft. Among them is the long-running Dawn mission, which is on its way to the dwarf planet Ceres (by way of Vesta) and should settle into orbit in April after a radiation blast delayed the original flight plan.

And today (Dec. 1) comes a special day for Dawn — when it turns its cameras to Ceres to capture the world, which will appear about nine pixels across. The reason? Besides scientific curiosity, it turns out to be a perfect calibration target, according to NASA.

“One final calibration of the science camera is needed before arrival at Ceres,” wrote Marc Rayman, the mission director at the Jet Propulsion Laboratory, in a recent blog post.

“To accomplish it, the camera needs to take pictures of a target that appears just a few pixels across. The endless sky that surrounds our interplanetary traveler is full of stars, but those beautiful pinpoints of light, while easily detectable, are too small for this specialized measurement. But there is an object that just happens to be the right size. On Dec. 1, Ceres will be about nine pixels in diameter, nearly perfect for this calibration.”


The Dawn spacecraft's first image of Ceres, taken July 20, 2010. Credit: NASA/JPL-Caltech/MPS/DLR/IDA


The Dawn spacecraft’s first image of Ceres, taken July 20, 2010. Credit: NASA/JPL-Caltech/MPS/DLR/IDA
This isn’t the first picture of Ceres by Dawn — not by a long-shot — but it sure will loom bigger than you see in the image at left, which was taken in 2010. Dawn hadn’t even arrived at Vesta at the time, the blog post points out, and the spacecraft was about 1,300 times further from Ceres then as it is now. Translating that into visual magnitude, the new pictures of Ceres will show an appearance about as bright as Venus, from Earth’s perspective.

In October, the Dawn blog said that more pictures of Ceres are planned on Jan. 13, when Ceres will appear 25 pixels across. This won’t be quite the best view ever — that was taken by the Hubble Space Telescope, which you can see below, — but just wait a couple of weeks. The mission planners say that by Jan. 26, the images will be slightly better. On Feb. 4, they will be twice as good and by Feb. 20, seven times as good.

As with the calibration photo taken today, these photos in 2015 will have a double purpose: optical navigation. It’s to help the spacecraft figure out where to go, because our pictures of Ceres are so fuzzy that mission planners will need more exact information as the mission proceeds.

You can read more information about the picture-taking, and Dawn’s planned approach to Ceres, in the Nov. 28 entry of the Dawn blog.


Pictures of the asteroid Ceres taken by the Hubble Space Telescope and released in 2005. It shows the asteroid moving over two hours and 20 minutes, which is about a quarter of a day on Ceres (nine hours). At the time, scientists said the bright spot is a mystery. Credit: NASA, ESA, J. Parker (Southwest Research Institute), P. Thomas (Cornell University), and L. McFadden (University of Maryland, College Park)


Pictures of the asteroid Ceres taken by the Hubble Space Telescope and released in 2005. It shows the asteroid rotating over two hours and 20 minutes, which is about a quarter of a day on Ceres (nine hours). At the time, scientists said the bright spot is a mystery. Credit: NASA, ESA, J. Parker (Southwest Research Institute), P. Thomas (Cornell University), and L. McFadden (University of Maryland, College Park)


About 

Elizabeth Howell is the senior writer at Universe Today. She also works for Space.com, Space Exploration Network, the NASA Lunar Science Institute, NASA Astrobiology Magazine and LiveScience, among others. Career highlights include watching three shuttle launches, and going on a two-week simulated Mars expedition in rural Utah. You can follow her on Twitter @howellspace or contact her at her website.

The Inner Planets of Our Solar System

The Inner Planets of Our Solar System:


The terrestrial planets of our Solar System at approximately relative sizes. From left, Mercury, Venus, Earth and Mars. Credit: Lunar and Planetary Institute


The terrestrial planets of our Solar System at approximately relative sizes. From left, Mercury, Venus, Earth and Mars. Credit: Lunar and Planetary Institute
Our Solar System is an immense and amazing place. Between its eight planets, 176 moons, 5 dwarf planets (possibly hundreds more), 659,212 known asteroids, and 3,296 known comets, it has wonders to sate the most demanding of curiosities.

Our Solar System is made up of different regions, which are delineated based on their distance from the Sun, but also the types of planets and bodies that can be found within them.

In the inner Solar System, we find the “Inner Planets” – Mercury, Venus, Earth, and Mars – which are so named because they orbit closest to the Sun. In addition to their proximity, these planets have a number of key differences that set them apart from planets elsewhere in the Solar System.

For starters, the inner planets are rocky and terrestrial, composed mostly of silicates and metals, whereas the outer planets are gas giants. The inner planets are also much more closely spaced than their outer Solar System counterparts. In fact, the radius of the entire region is less than the distance between the orbits of Jupiter and Saturn.


The positions and names of planets and dwarf planets in the solar system. Credit: Planets2008/Wikimedia Commons


The positions and names of planets and dwarf planets in the solar system.
Credit: Planets2008/Wikimedia Commons
This region is also within the “frost line,” which is a little less than 5 AU (about 700 million km) from the Sun. This line represents the boundary in a system where conditions are warm enough that hydrogen compounds such as water, ammonia, and methane are able to take liquid form. Beyond the frost line, these compounds condense into ice grains.Some scientists refer to the frost line as the “Goldilocks Zone” — where conditions for life may be “just right.”

Generally, inner planets are smaller and denser than their counterparts, and have few to no moons or rings circling them. The outer planets, meanwhile, often have dozens of satellites and rings composed of particles of ice and rock.

The terrestrial inner planets are composed largely of refractory minerals, such as the silicates, which form their crusts and mantles, and metals such as iron and nickel which form their cores. Three of the four inner planets (Venus, Earth and Mars) have atmospheres substantial enough to generate weather. All of them have impact craters and tectonic surface features as well, such as rift valleys and volcanoes.

Of the inner planets, Mercury is the closest to our Sun and the smallest of the terrestrial planets. This small planet looks very much like the Earth’s Moon and is even a similar grayish color, and it even has many deep craters and is covered by a thin layer of tiny particle silicates.

Its magnetic field is only about 1 percent that of Earth’s, and it’s very thin atmosphere means that it is hot during the day (up to 430°C) and freezing at night (as low as -187 °C) because the atmosphere can neither keep heat in or out. It has no moons of its own and is comprised mostly of iron and nickel. Mercury is one of the densest planets in the Solar System.


The inner planets to scale. From left to right: Earth, Mars, Venus, and Mercury. Credit: Wikimedia Commons/Lsmpascal


The inner planets to scale. From left to right: Earth, Mars, Venus, and Mercury. Credit: Wikimedia Commons/Lsmpascal
Venus, which is about the same size as Earth, has a thick toxic atmosphere that traps heat, making it the hottest planet in the Solar System. This atmosphere is composed of 96% carbon dioxide, along with nitrogen and a few other gases. Dense clouds within Venus’ atmosphere are composed of sulphuric acid and other corrosive compounds, with very litte water.

Only two spacecraft have ever penetrated Venus’s thick atmosphere, but it’s not just man-made objects that have trouble getting through. There are fewer crater impacts on Venus than other planets because all but the largest meteors don’t make it through the thick air without disintegrating. Much of Venus’ surface is marked with volcanoes and deep canyons — the biggest of which is over 6400 km (4,000 mi) long.

Venus is often called the “morning star” because, with the exception of Earth’s moon, it’s the brightest object we see in the sky. Like Mercury, Venus has no moon of its own.

Earth is the third inner planet and the one we know best. Of the four terrestrial planets, Earth is the largest, and the only one that currently has liquid water, which is necessary for life as we know it. Earth’s atmosphere protects the planet from dangerous radiation and helps keep valuable sunlight and warmth in, which is also essential for life to survive.

Like the other terrestrial planets, Earth has a rocky surface with mountains and canyons, and a heavy metal core. Earth’s atmosphere contains water vapor, which helps to moderate daily temperatures. Like Mercury, the Earth has an internal magnetic field. And our Moon, the only one we have, is comprised of a mixture of various rocks and minerals.


Inner Solar System. Image credit: NASA


Illustration of the Inner Planets and their orbits around the Sun Image credit: NASA
Mars is the fourth and final inner planet, and also known as the “Red Planet” due to the rust of iron-rich materials that form the planet’s surface. Mars also has some of the most interesting terrain features of any of the terrestrial planets. These include the largest mountain in the Solar System – Olympus Mons – which rises some 21,229 m (69,649 ft) above the surface, and a giant canyon called Valles Marineris. Valles Marineris is 4000 km (2500 mi) long and reaches depths of up to 7 km (4 mi)! For comparison, the Grand Canyon in Arizona is about 800 km (500 mi) long and 1.6 km (1 mi) deep. In fact, the extent of Valles Marineris is as long as the United States and it spans about 20 percent (1/5) of the entire distance around Mars.

Much of the surface is very old and filled with craters, but there are geologically newer areas of the planet as well. At the Martian poles are polar ice caps that shrink in size during the Martian spring and summer. Mars is less dense than Earth and has a smaller magnetic field, which is indicative of a solid core, rather than a liquid one

Mars’ thin atmosphere has led some astronomers to believe that the surface water that once existed there might have actually taken liquid form, but has since evaporated into space. The planet has two small moons called Phobos and Deimos.

Beyond Mars are the four outer planets: Jupiter, Saturn, Uranus, and Neptune.

If you are looking for more information, check out this article from NASA on the planets of the Solar System and this article from Solstation about the inner planets.

Universe Today has numerous articles on the inner planets including the planets of the inner Solar System as well as a detailed breakdown of all the planets in the Solar System.

Astronomy Cast also has episodes on all of the inner planets including this one about Mercury.


About 

Author, freelance writer, educator, Taekwon-Do instructor, and loving hubby, son and Island boy!

Jupiter-Bound Spacecraft Takes A Small Step To Seek Habitable Worlds

Jupiter-Bound Spacecraft Takes A Small Step To Seek Habitable Worlds:


Artist's impression of the Jupiter Icy Moons Explorer (JUICE) near Jupiter and one of its moons, Europa. Credit: ESA/AOES


Artist’s impression of the Jupiter Icy Moons Explorer (JUICE) near Jupiter and one of its moons, Europa. Credit: ESA/AOES
It takes years of painstaking work to get a spacecraft off the ground. So when you have a spacecraft like JUICE (the Jupiter Icy Moons Explorer) set to launch in 2022, you need to back up about a decade to get things figured out. How will the spacecraft get there? What science instruments will it carry? What will the spacecraft look like and what systems will support its work?

JUICE just hit another milestone in its development a few days ago, when the European Space Agency gave the go-ahead for the “implementation phase” — the part where the spacecraft design begins to take shape. The major goal of the mission will be to better understand those moons around Jupiter that could be host to life.

The spacecraft will reach Jupiter’s system in 2030 and begin with observations of the mighty planet — the biggest in our Solar System — to learn more about the gas giant’s atmosphere, faint rings and magnetic environment. It also will be responsible for teaching us more about Europa (an icy world that could host a global ocean) and Callisto (a moon pockmarked with the most craters of anything in the Solar System.)

Its major departure from past missions, though, will come when JUICE enters orbit around Ganymede. This will the first time any spacecraft has circled an icy moon repeatedly; past views of the moon have only come through flybys by the passing-through spacecraft (such as Pioneer and Voyager) and the Galileo mission, which stuck around Jupiter’s system in the 1990s and early 2000s.

Ganymede
Ganymede Credit: NASA
With Ganymede, another moon thought to host a global ocean, JUICE will examine its surface and insides. What makes the moon unique in our neighborhood is its ability to create its own magnetic field, which creates interesting effects when it interacts with Jupiter’s intense magnetic environment.

“Jupiter’s diverse Galilean moons – volcanic Io, icy Europa and rock-ice Ganymede and Callisto – make the Jovian system a miniature Solar System in its own right,” the European Space Agency stated when the mission was selected in 2012.

“With Europa, Ganymede and Callisto all thought to host internal oceans, the mission will study the moons as potential habitats for life, addressing two key themes of cosmic vision: what are the conditions for planet formation and the emergence of life, and how does the Solar System work?”

JUICE is one of several major spacecraft ESA plans to launch in the next couple of decades. You can read more about the other Cosmic Vision candidates at this ESA website.

Source: European Space Agency


About 

Elizabeth Howell is the senior writer at Universe Today. She also works for Space.com, Space Exploration Network, the NASA Lunar Science Institute, NASA Astrobiology Magazine and LiveScience, among others. Career highlights include watching three shuttle launches, and going on a two-week simulated Mars expedition in rural Utah. You can follow her on Twitter @howellspace or contact her at her website.

What Percent of Earth is Water?

What Percent of Earth is Water?:


What Percent of Earth is Water


Earth – Western Hemisphere. Credit: NASA/MODIS/USGS
The Earth is often compared to a majestic blue marble, especially by those privileged few who have gazed upon it from orbit. This is due to the prevalence of water on the planet’s surface. While water itself is not blue, water gives off blue light upon reflection.

For those of us confined to living on the surface, the fact that our world is mostly covered in water is a well known fact. But how much of our planet is made up of water, exactly? Like most facts pertaining to our world, the answer is a little more complicated than you might think, and takes into account a number of different qualifications.

In simplest terms, water makes up about 71% of the Earth’s surface, while the other 29% consists of continents and islands.

To break the numbers down, 96.5% of all the Earth’s water is contained within the oceans as salt water, while the remaining 3.5% is freshwater lakes and frozen water locked up in glaciers and the polar ice caps. Of that fresh water, almost all of it takes the form of ice: 69% of it, to be exact. If you could melt all that ice, and the Earth’s surface was perfectly smooth, the sea levels would rise to an altitude of 2.7 km.


Illustration showing all of Earth's water, liquid fresh water, and water in lakes and rivers. Credit: Howard Perlman/USGS/Jack Cook/WHOI


Illustration showing all of Earth’s water, liquid fresh water, and water in lakes and rivers. Credit: Howard Perlman, USGS/illustraion by Jack Cook, WHOI
Aside from the water that exists in ice form, there is also the staggering amount of water that exists beneath the Earth’s surface. If you were to gather all the Earth’s fresh water together as a single mass (as shown in the image above) it is estimated that it would measure some 1,386 million cubic kilometers (km3) in volume.

Meanwhile, the amount of water that exists as groundwater, rivers, lakes, and streams would constitute just over 10.6 million km3, which works out to a little over 0.7%. Seen in this context, the limited and precious nature of freshwater becomes truly clear.

But how much of Earth is water — how much water contributes to the actual mass of the planet? This includes not just the surface of the Earth, but inside as well. Scientists calculate that the total mass of the oceans on Earth is 1.35 x 10¹⁸ metric tonnes, which is 1/4400 the total mass of the Earth. In other words, while the oceans cover 71% of the Earth’s surface, they only account for 0.02% of our planet’s total mass.

The origin of water on the Earth’s surface, as well as the fact that it has more water than any other rocky planet in the Solar System, are two of long-standing mysteries concerning our planet.


Many theories about the origins of water on Earth attribute it to collisions with comets and asteroids. Credit: NASA/JPL/Caltech


Many theories about the origins of water on Earth attribute it to collisions with comets and asteroids. Credit: NASA/JPL/Caltech
Not that long ago, it was believed that our planet formed dry some 4.6 billion years ago, with high-energy impacts creating a molten surface on the infant Earth. According to this theory, water was brought to the world’s oceans thanks to icy comets, trans-Neptunian objects or water-rich meteoroids (protoplanets) from the outer reaches of the main asteroid belt colliding with the Earth.

However, more recent research conducted by the Woods Hole Oceanographic Institution (WHOI) in Woods Hole, Massachusetts, has pushed the date of these origins back further. According to this new study, the world’s oceans also date back 4.6 billion years, when all the worlds of the inner Solar System were still forming.

This conclusion was reached by examining meteorites thought to have formed at different times in the history of the Solar System. Carbonaceous chondrite, the oldest meteorites that have been dated to the very earliest days of the Solar System, were found to have the same chemistry as those originating from protoplanets like Vesta. This includes a significance presence of water.

These meteorites are dated to the same epoch in which water was believed to have formed on Earth – some 11 million years after the formation of the Solar System. In short, it now appears that meteorites were depositing water on Earth in its earliest days.

While not ruling out the possibility that some of the water that covers 71 percent of Earth today may have arrived later, these findings suggest that there was enough already here for life to have begun earlier than thought.

We’ve written many articles about the oceans for Universe Today. Here’s an article about how many oceans there are, and here’s an article about why Earth may have less water than you might think. (providing more detail about the WHOI image above.

If you’d like more info on Earth, check out NASA’s Solar System Exploration Guide on Earth. And here’s a link to NASA’s Earth Observatory.

We’ve also recorded an episode of Astronomy Cast all about planet Earth. Listen here, Episode 51: Earth.

Further reading: USGS


About 

Author, freelance writer, educator, Taekwon-Do instructor, and loving hubby, son and Island boy!

Pluto’s Closeup Will Be Awesome Based On Jupiter Pics From New Horizons Spacecraft

Pluto’s Closeup Will Be Awesome Based On Jupiter Pics From New Horizons Spacecraft:


A montage of images taken of Jupiter and its moon Io (foreground) by the New Horizons mission in 2007. Jupiter is shown in infrared wavelengths while Io is close to true-color. On top of Io is an eruption from the volcano Tvashtar. Credit: NASA/Johns Hopkins University Applied Physics Laboratory/Southwest Research Institute


A montage of images taken of Jupiter and its moon Io (foreground) by the New Horizons mission in 2007. Jupiter is shown in infrared wavelengths while Io is close to true-color. On top of Io is an eruption from the volcano Tvashtar. Credit: NASA/Johns Hopkins University Applied Physics Laboratory/Southwest Research Institute
New Horizons, you gotta wake up this weekend. There’s so much work ahead of you when you reach Pluto next year! The spacecraft has been sleeping quietly for weeks in its last great hibernation before the dwarf planet close encounter in July. On Saturday (Dec. 6), the NASA craft will open its eyes and begin preparations for that flyby.

How cool will those closeups of Pluto and its moons look? A hint comes from a swing New Horizons took by Jupiter in 2007 en route. It caught a huge volcanic plume erupting off of the moon Io, picked up new details in Jupiter’s atmosphere and gave scientists a close-up of a mysterious “Little Red Spot.” Get a taste of the fun seven years ago in the gallery below.


An eruption from the Tvashtar volcano on Io, Jupiter's moon, in several different wavelength images taken by the New Horizons spacecraft in 2007. The left image from the Long Range Reconnaissance Imager (LORRI) shows lava glowing in the night. At top right, the Multispectral Visible Imaging Camera (MVIC) spotted sulfur and sulfor dioxide deposits on the sunny side of Io. The remaining image from the Linear Etalon Imaging Spectral Array (LEISA) shows volcanic hotspots on Io's surface. Credit: NASA/Johns Hopkins University Applied Physics Laboratory/Southwest Research Institute


An eruption from the Tvashtar volcano on Io, Jupiter’s moon, in several different wavelength images taken by the New Horizons spacecraft in 2007. The left image from the Long Range Reconnaissance Imager (LORRI) shows lava glowing in the night. At top right, the Multispectral Visible Imaging Camera (MVIC) spotted sulfur and sulfor dioxide deposits on the sunny side of Io. The remaining image from the Linear Etalon Imaging Spectral Array (LEISA) shows volcanic hotspots on Io’s surface. Credit: NASA/Johns Hopkins University Applied Physics Laboratory/Southwest Research Institute


Jupiter's "Little Red Spot" seen by the New Horizons spacecraft in 2007. The spot turned red in 2005 for reasons scientists were then unsure of, but speculated it could be due to stuff from inside the atmosphere being stirred up by a storm surge. Credit: NASA/Johns Hopkins University Applied Physics Laboratory/Southwest Research Institute


Jupiter’s “Little Red Spot” seen by the New Horizons spacecraft in 2007. The spot turned red in 2005 for reasons scientists were then unsure of, but speculated it could be due to stuff from inside the atmosphere being stirred up by a storm surge. Credit: NASA/Johns Hopkins University Applied Physics Laboratory/Southwest Research Institute


A "family portrait" of the four Galilean satellites around Jupiter taken by the New Horizons spacecraft and released in 2007. From left, the montage includes Io, Europa, Ganymede and Callisto. Credit: NASA/Johns Hopkins University Applied Physics Laboratory/Southwest Research Institute


A “family portrait” of the four Galilean satellites around Jupiter taken by the New Horizons spacecraft and released in 2007. From left, the montage includes Io, Europa, Ganymede and Callisto. Credit: NASA/Johns Hopkins University Applied Physics Laboratory/Southwest Research Institute


A composite of Jupiter's bands (and atmospheric structures) taken in several images by the New Horizons Multispectral Visual Imaging Camera, showing differences due to sunlight and wind. Credit: NASA/Johns Hopkins University Applied Physics Laboratory/Southwest Research Institute


A composite of Jupiter’s bands (and atmospheric structures) taken in several images by the New Horizons Multispectral Visual Imaging Camera, showing differences due to sunlight and wind. Credit: NASA/Johns Hopkins University Applied Physics Laboratory/Southwest Research Institute


In February and March 2007, a huge plume erupted from the Tvashtar volcano on Jupiter's moon Io. The image sequence taken by New Horizons showed the largest such explosion then viewed by a spacecraft -- even accounting for the Galileo spacecraft that examined Io between 1996 and 2001. Credit: NASA/Johns Hopkins University Applied Physics Laboratory/Southwest Research Institute


In February and March 2007, a huge plume erupted from the Tvashtar volcano on Jupiter’s moon Io. The image sequence taken by New Horizons showed the largest such explosion then viewed by a spacecraft — even accounting for the Galileo spacecraft that examined Io between 1996 and 2001. Credit: NASA/Johns Hopkins University Applied Physics Laboratory/Southwest Research Institute


The New Horizons flyby of Io in 2007 (right) revealed a changing feature on the surface of the Jupiter moon since Galileo's image of 1999 (left.) Inside the circle, a new volcanic eruption spewed material; other pictures showed this region was still active. Credit: NASA/Johns Hopkins University Applied Physics Laboratory/Southwest Research Institute


The New Horizons flyby of Io in 2007 (right) revealed a changing feature on the surface of the Jupiter moon since Galileo’s image of 1999 (left.) Inside the circle, a new volcanic eruption spewed material; other pictures showed this region was still active. Credit: NASA/Johns Hopkins University Applied Physics Laboratory/Southwest Research Institute


About 

Elizabeth Howell is the senior writer at Universe Today. She also works for Space.com, Space Exploration Network, the NASA Lunar Science Institute, NASA Astrobiology Magazine and LiveScience, among others. Career highlights include watching three shuttle launches, and going on a two-week simulated Mars expedition in rural Utah. You can follow her on Twitter @howellspace or contact her at her website.

Famous Hubble Star Explosion Is Expanding, New Animation Reveals

Famous Hubble Star Explosion Is Expanding, New Animation Reveals:


The Eta Carinae nebula expands in images taken by the Hubble Space Telescope in 1995, 2001 and 2008. Image used with permission by the animation authors. Credit: Hubble, NASA, ESA. Processing and copyright: First Light, J. L. Dauvergne, P. Henarejos
Wow! One of the most famous star explosions captured by the Hubble Space Telescope — several times — shows clear evidence of expansion in this new animation. You can see here the Homunculus Nebula getting bigger and bigger between 1995 and 2008, when Hubble took pictures of the Eta Carinae star system. More details from one of the animation authors below.

“I had the idea to check the Hubble image of Eta Carinae because I know this star rather well,” wrote Philippe Henarejos, one of the authors of the animation, in an e-mail to Universe Today. Henarejos has written several times about the star for the magazine he edits, Ciel et espace (Sky and Space) and also published a French-language book on star histories.

“Telling this story, I realized that astronomers knew for a long time that the Homunculus Nebula was expanding. Also, I knew that the HST had taken many photos of this object since 1995. So I thought that thanks to the very high resolution of the HST images, it could be possible to see the expansion.”


Eta Carinae from Hubble's STIS instrument. Credit: NASA, ESA, and the Hubble SM4 ERO Team


Eta Carinae from Hubble’s STIS instrument. Credit: NASA, ESA, and the Hubble SM4 ERO Team
Along with colleague Jean-Luc Dauvergne, Henarejos tracked down two images in the archives and searched for a fixed object that wouldn’t be moving as the expansion occurred, which they decided would be two stars close to the border of the field of view. Then Dauvergne found a third image that clearly showed the expansion happening.

The two gentlemen then verified their findings with astronomer John Martin from the University of Illinois, who maintains a page on Eta Carinae. “He told me that the expansion is real,” Henarejos said.

And the animation is already getting attention. After being published in the new magazine First Light, it was featured today on the Astronomy Picture of the Day website.

Eta Carinae mysteriously brightened about 170 years ago, becoming the second-most luminous object in Earth’s night sky. Then it faded 150 years ago. Astronomers are still examining the system to see what might have caused this.


About 

Elizabeth Howell is the senior writer at Universe Today. She also works for Space.com, Space Exploration Network, the NASA Lunar Science Institute, NASA Astrobiology Magazine and LiveScience, among others. Career highlights include watching three shuttle launches, and going on a two-week simulated Mars expedition in rural Utah. You can follow her on Twitter @howellspace or contact her at her website.

New Cosmological Theory Goes Inflation-Free

New Cosmological Theory Goes Inflation-Free:


This image, the best map ever of the Universe, shows the oldest light in the universe. This glow, left over from the beginning of the cosmos called the cosmic microwave background, shows tiny changes in temperature represented by color. Credit: ESA and the Planck Collaboration.


This gorgeous image of the oldest light in the Universe was created by the Planck satellite in 2013. Patterns in the hot and cold spots shown here have been perplexing scientists for years, leading some to suggest that they are evidence of new cosmology. Credit: ESA and the Planck Collaboration.
The Cosmic Microwave Background (CMB) radiation is one of the greatest discoveries of modern cosmology. Astrophysicist George Smoot once likened its existence to “seeing the face of God.” In recent years, however, scientists have begun to question some of the attributes of the CMB. Peculiar patterns have emerged in the images taken by satellites such as WMAP and Planck – and they aren’t going away. Now, in a paper published in the December 1 issue of The Astronomical Journal, one scientist argues that the existence of these patterns may not only imply new physics, but also a revolution in our understanding of the entire Universe.

Let’s recap. Thanks to a blistering ambient temperature, the early Universe was blanketed in a haze for its first 380,000 years of life. During this time, photons relentlessly bombarded the protons and electrons created in the Big Bang, preventing them from combining to form stable atoms. All of this scattering also caused the photons’ energy to manifest as a diffuse glow. The CMB that cosmologists see today is the relic of this glow, now stretched to longer, microwave wavelengths due to the expansion of the Universe.

As any fan of the WMAP and Planck images will tell you, the hallmarks of the CMB are the so-called anisotropies, small regions of overdensity and underdensity that give the picture its characteristic mottled appearance. These hot and cold spots are thought to be the result of tiny quantum fluctuations born at the beginning of the Universe and magnified exponentially during inflation.


Temperature and polarization around hot and cold spots (Credit: NASA / WMAP Science Team)


Temperature and polarization around hot and cold spots (Credit: NASA / WMAP Science Team)
Given the type of inflation that cosmologists believe occurred in the very early Universe, the distribution of these anisotropies in the CMB should be random, on the order of a Gaussian field. But both WMAP and Planck have confirmed the existence of certain oddities in the fog: a large “cold spot,” strange alignments in polarity known as quadrupoles and octupoles, and, of course, Stephen Hawking’s initials.

In his new paper, Fulvio Melia of the University of Arizona argues that these types of patterns (Dr. Hawking’s signature notwithstanding) reveal a problem with the standard inflationary picture, or so-called ΛCDM cosmology. According to his calculations, inflation should have left a much more random assortment of anisotropies than the one that scientists see in the WMAP and Planck data. In fact, the probability of these particular anomalies lining up the way they do in the CMB images is only about 0.005% for a ΛCDM Universe.

Melia posits that the anomalous patterns in the CMB can be better explained by a new type of cosmology in which no inflation occurred. He calls this model the R(h)=ct Universe, where c is the speed of light, t is the age of the cosmos, and R(h) is the Hubble radius – the distance beyond which light will never reach Earth. (This equation makes intuitive sense: Light, traveling at light speed (c) for 13.7 billion years (t), should travel an equivalent number of light-years. In fact, current estimates of the Hubble radius put its value at about 13.4 billion light-years, which is remarkably close to the more tightly constrained value of the Universe’s age.)

R(h)=ct holds true for both the standard cosmological scenario and Melia’s model, with one crucial difference: in ΛCDM cosmology, this equation only works for the current age of the Universe. That is, at any time in the distant past or future, the Universe would have obeyed a different law. Scientists explain this odd coincidence by positing that the Universe first underwent inflation, then decelerated, and finally accelerated again to its present rate.

Melia hopes that his model, a Universe that requires no inflation, will provide an alternative explanation that does not rely on such fine-tuning. He calculates that, in a R(h)=ct Universe, the probability of seeing the types of strange patterns that have been observed in the CMB by WMAP and Planck is 7–10%, compared with a figure 1000 times lower for the standard model.

So, could this new way of looking at the cosmos be a death knell for ΛCDM? Probably not. Melia himself cites a few less earth-shattering explanations for the anomalous signals in the CMB, including foreground noise, statistical biases, and instrumental errors. Incidentally, the Planck satellite is scheduled to release its latest image of the CMB this week at a conference in Italy. If these new results show the same patterns of polarity that previous observations did, cosmologists will have to look into each possible explanation, including Melia’s theory, more intensively.


About 

Vanessa earned her bachelor's degree in Astronomy and Physics in 2009 from Wheaton College in Massachusetts. Her credits in astronomy include observing and analyzing eclipsing binary star systems and taking a walk on the theory side as a NSF REU intern, investigating the impact of type 1a supernovae on the expansion of the Universe. In her spare time she enjoys writing about astrophysics and cosmology, making delicious vegetarian meals, taking adventures with her husband and/or Nikon D50, and saving the world.

Planets Could Travel Along with Rogue ‘Hypervelocity’ Stars, Spreading Life Throughout the Universe

Planets Could Travel Along with Rogue ‘Hypervelocity’ Stars, Spreading Life Throughout the Universe:


An artist's conception of a hypervelocity star that has escaped the Milky Way. Image Credit: NASA


An artist’s conception of a hypervelocity star that has escaped the Milky Way. Image Credit: NASA
Back in 1988, astronomer Jack Hills predicted a type of “rogue”star might exist that is not bound to any particular galaxy. These stars, he reasoned, were periodically ejected from their host galaxy by some sort of mechanism to begin traveling through interstellar space.

Since that time, astronomers have made numerous discoveries that indicate these rogue, traveling stars indeed do exist, and far from being an occasional phenomenon, they are actually quite common. What’s more, some of these stars were found to be traveling at extremely high speeds, leading to the designation of hypervelocity stars (HVS).

And now, in a series of papers that published in arXiv Astrophysics, two Harvard researchers have argued that some of these stars may be traveling close to the speed of light. Known as semi-relativistic hypervelocity stars (SHS), these fast-movers are apparently caused by galactic mergers, where the gravitational effect is so strong that it fling stars out of a galaxy entirely. These stars, the researchers say, may have the potential to spread life throughout the Universe.

This finding comes on the heels of two other major announcements. The first occurred in early November when a paper published in the Astrophysical Journal reported that as many as 200 billion rogue stars have been detected in a cluster of galaxies some 4 billion light years away. These observations were made by the Hubble Space Telescope’s Frontier Fields program, which made ultra-deep multiwavelength observations of the Abell 2744 galaxy cluster.

This was followed by a study published in Science, where an international team of astronomers claimed that as many as half the stars in the entire universe live outside of galaxies.

Using ESO's Very Large Telescope, astronomers have recorded a massive star moving at more than 2.6 million kilometres per hour. Stars are not born with such large velocities. Its position in the sky leads to the suggestion that the star was kicked out from the Large Magellanic Cloud, providing indirect evidence for a massive black hole in the Milky Way's closest neighbour. Credit: ESO


Image of a moving star captured by the ESO Very Large Telescope, believed to have been ejected from the Large Magellanic Cloud. Credit: ESO
However, the recent observations made by Abraham Loeb and James Guillochon of Harvard University are arguably the most significant yet concerning these rogue celestial bodies. According to their research papers, these stars may also play a role in spreading life beyond the boundaries of their host galaxies.

In their first paper, the researchers trace these stars to galaxy mergers, which presumably lead to the formation of massive black hole binaries in their centers. According to their calculations, these supermassive black holes (SMBH) will occasionally slingshot stars to semi-relativistic speeds.

“We predict the existence of a new population of stars coasting through the Universe at nearly the speed of light,” Loeb told Universe Today via email. “The stars are ejected by slingshots made of pairs of massive black holes which form during mergers of galaxies.”

These findings have further reinforced that massive compact bodies, widely known as a supermassive black holes (SMBH), exist at the center of galaxies. Here, the fastest known stars exist, orbiting the SMBH and accelerating up to speeds of 10,000 km per second (3 percent the speed of light).

According to Leob and Guillochon, however, those that are ejected as a result of galactic mergers are accelerated to anywhere from one-tenth to one-third the speed of light (roughly 30,000 – 100,000 km per second).


Image of a hypervelocity star found in data from the Sloan Digital Sky Survey. Credit: Vanderbilt University


Image of a hypervelocity star found in data from the Sloan Digital Sky Survey. Credit: Vanderbilt University
Observing these semi-relativistic stars could tell us much about the distant cosmos, according to the Harvard researchers. Compared to conventional research, which relied on subatomic particles like photons, neutrinos, and cosmic rays from distant galaxies, studying ejected stars offers numerous advantages.

“Traditionally, cosmologists used light to study the Universe but objects moving less than the speed of light offer new possibilities,” said Loeb. “For example, stars moving at different speeds allow us to probe a distant source galaxy at different look-back times (since they must have been ejected at different times in order to reach us today), in difference from photons that give us just one snapshot of the galaxy.”

In their second paper, the researchers calculate that there are roughly a trillion of these stars out there to be studied. And given that these stars were detected thanks to the Spitzer Space Telescope, it is likely that future generations will be able to study them using more advanced equipment.

All-sky infrared surveys could locate thousands of these stars speeding through the cosmos. And spectrographic analysis could tell us much about the galaxies they came from.

But how could these fast moving stars be capable of spreading life throughout the cosmos?


Could an alien spore really travel light years between different star systems? Well, as long as your theory doesn't require it to still be alive when it arrives - sure it can.


The Theory of Panspermia argues that life is distributed throughout the universe by celestial objects. Credit: NASA/Jenny Mottar
“Tightly bound planets can join the stars for the ride,” said Loeb. “The fastest stars traverse billions of light years through the universe, offering a thrilling cosmic journey for extra-terrestrial civilizations. In the past, astronomers considered the possibility of transferring life between planets within the solar system and maybe through our Milky Way galaxy. But this newly predicted population of stars can transport life between galaxies across the entire universe.”

The possibility that traveling stars and planets could have been responsible for the spread of life throughout the universe is likely to have implications as a potential addition to the Theory of Panspermia, which states that life exists throughout the universe and is spread by meteorites, comets, asteroids.

But Loeb told Universe Today that a traveling planetary system could have potential uses for our species someday.

“Our descendants might contemplate boarding a related planetary system once the Milky Way will merge with its sister galaxy, Andromeda, in a few billion years,” he said.

Further Reading: arxiv.org/1411.5022, arxiv.org/1411.5030


About 

Author, freelance writer, educator, Taekwon-Do instructor, and loving hubby, son and Island boy!