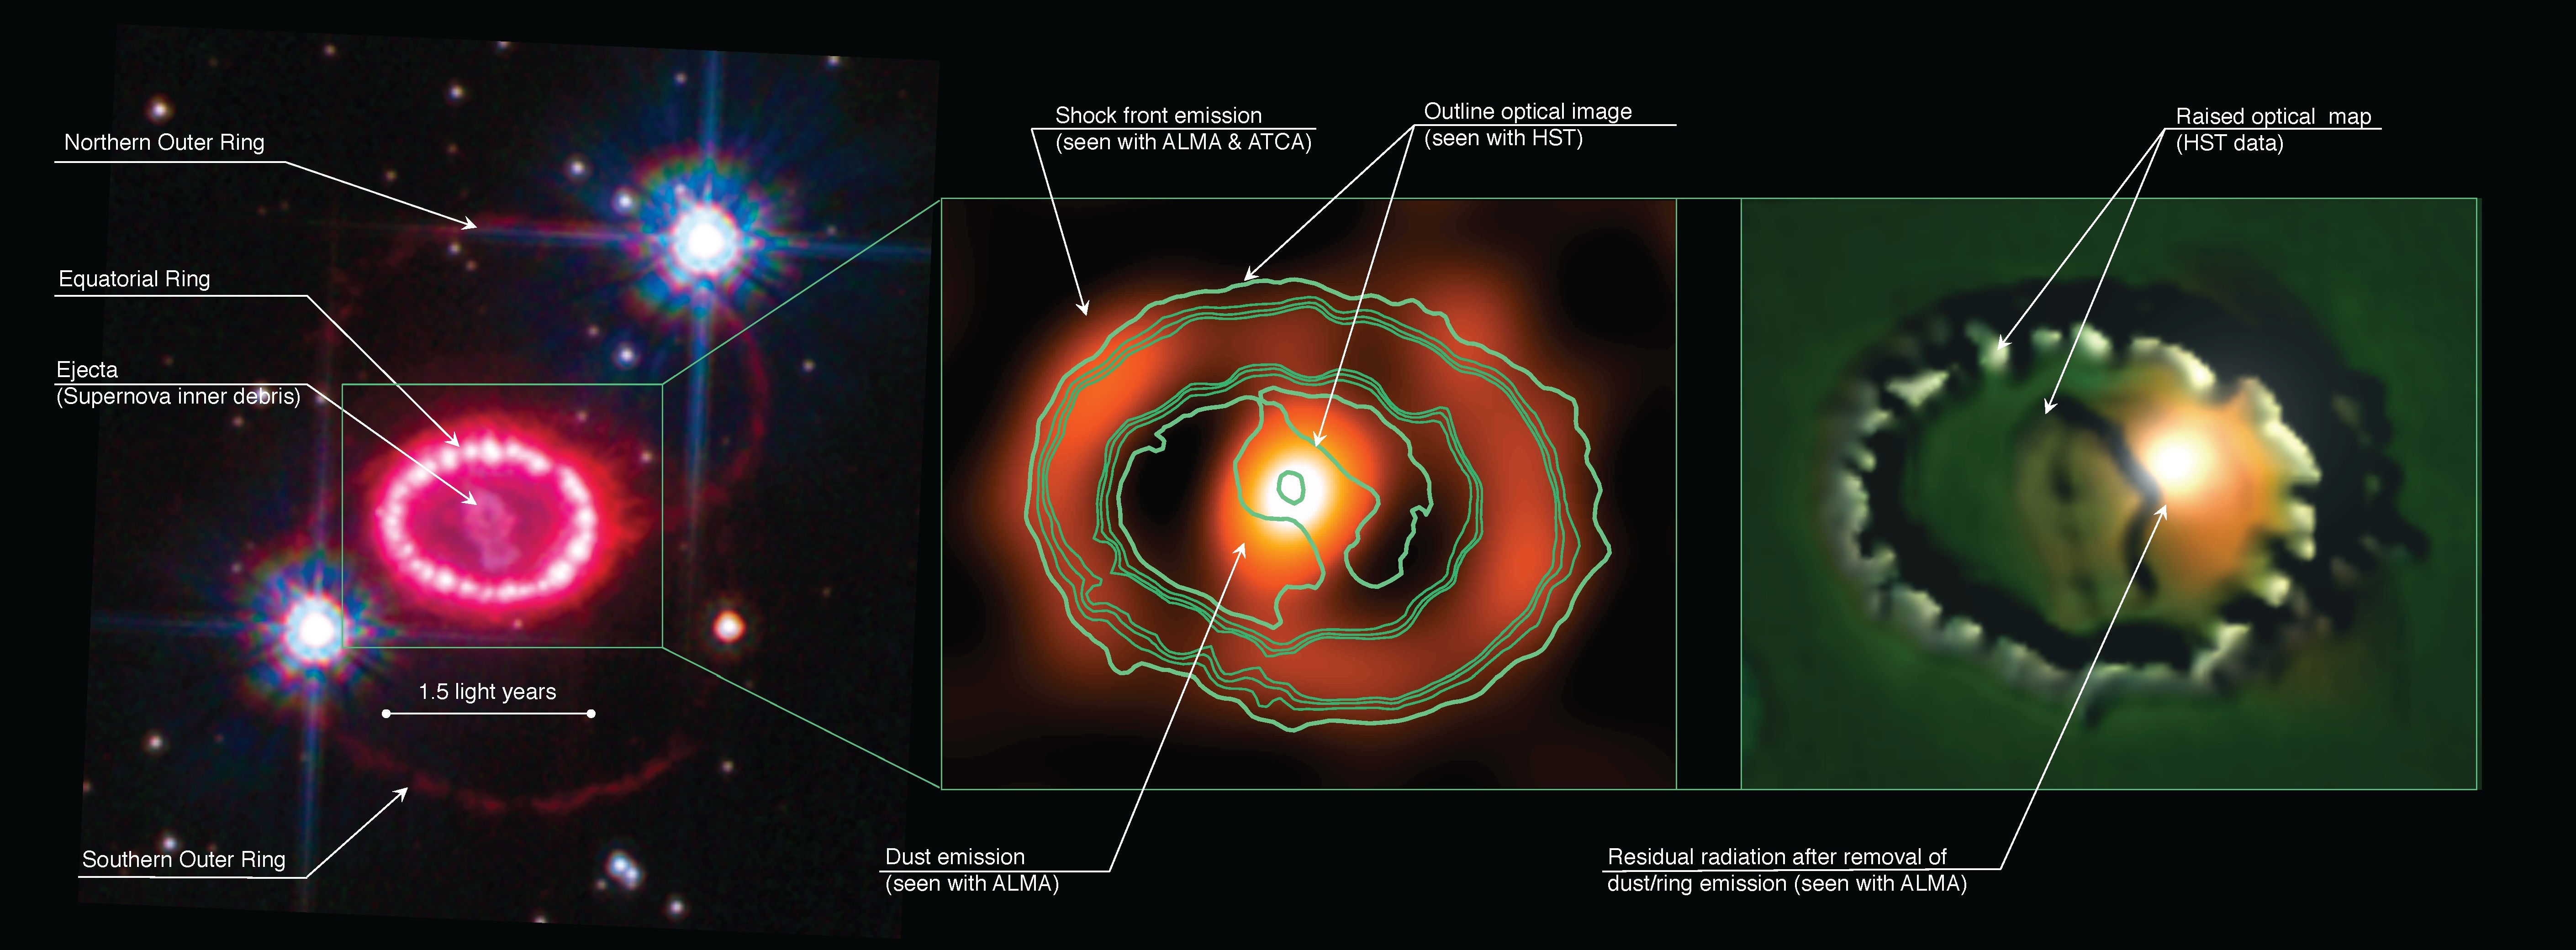
Left Panel: SNR1987A as seen by the Hubble Space Telescope in 2010.Middle Panel: SNR1987A as seen by the Australia Telescope Compact Array (ATCA) in New South Wales and the Atacama Large Millimeter/submillimeter Array (ALMA) in Chile. Right Panel: A computer generated visualization of the remnant showing the possible location of a Pulsar. Credit: ATCA & ALMA Observations & data – G. Zanardo et al. / HST Image: NASA, ESA, K. France (University of Colorado, Boulder), P. Challis and R. Kirshner (Harvard-Smithsonian Center for Astrophysics)
Representing the University of Western Australia node of the International Centre for Radio Astronomy Research, PhD Candidate Giovanna Zanardo led the team focusing on the supernova with the Australia Telescope Compact Array (ATCA) in New South Wales. Their observations took in the wavelengths spanning the radio to the far infrared.
“By combining observations from the two telescopes we’ve been able to distinguish radiation being emitted by the supernova’s expanding shock wave from the radiation caused by dust forming in the inner regions of the remnant,” said Giovanna Zanardo of the International Centre for Radio Astronomy Research (ICRAR) in Perth, Western Australia.
“This is important because it means we’re able to separate out the different types of emission we’re seeing and look for signs of a new object which may have formed when the star’s core collapsed. It’s like doing a forensic investigation into the death of a star.”
“Our observations with the ATCA and ALMA radio telescopes have shown signs of something never seen before, located at the centre or the remnant. It could be a pulsar wind nebula, driven by the spinning neutron star, or pulsar, which astronomers have been searching for since 1987. It’s amazing that only now, with large telescopes like ALMA and the upgraded ATCA, we can peek through the bulk of debris ejected when the star exploded and see what’s hiding underneath.”
A video compilation showing Supernova Remnant 1987A as seen by the Hubble Space Telescope in 2010, and by radio telescopes located in Australia and Chile in 2012. The piece ends with a computer generated visualization of the remnant showing the possible location of a Pulsar. Credit: Dr Toby Potter, ICRAR-UWA, Dr Rick Newton, ICRAR-UWA
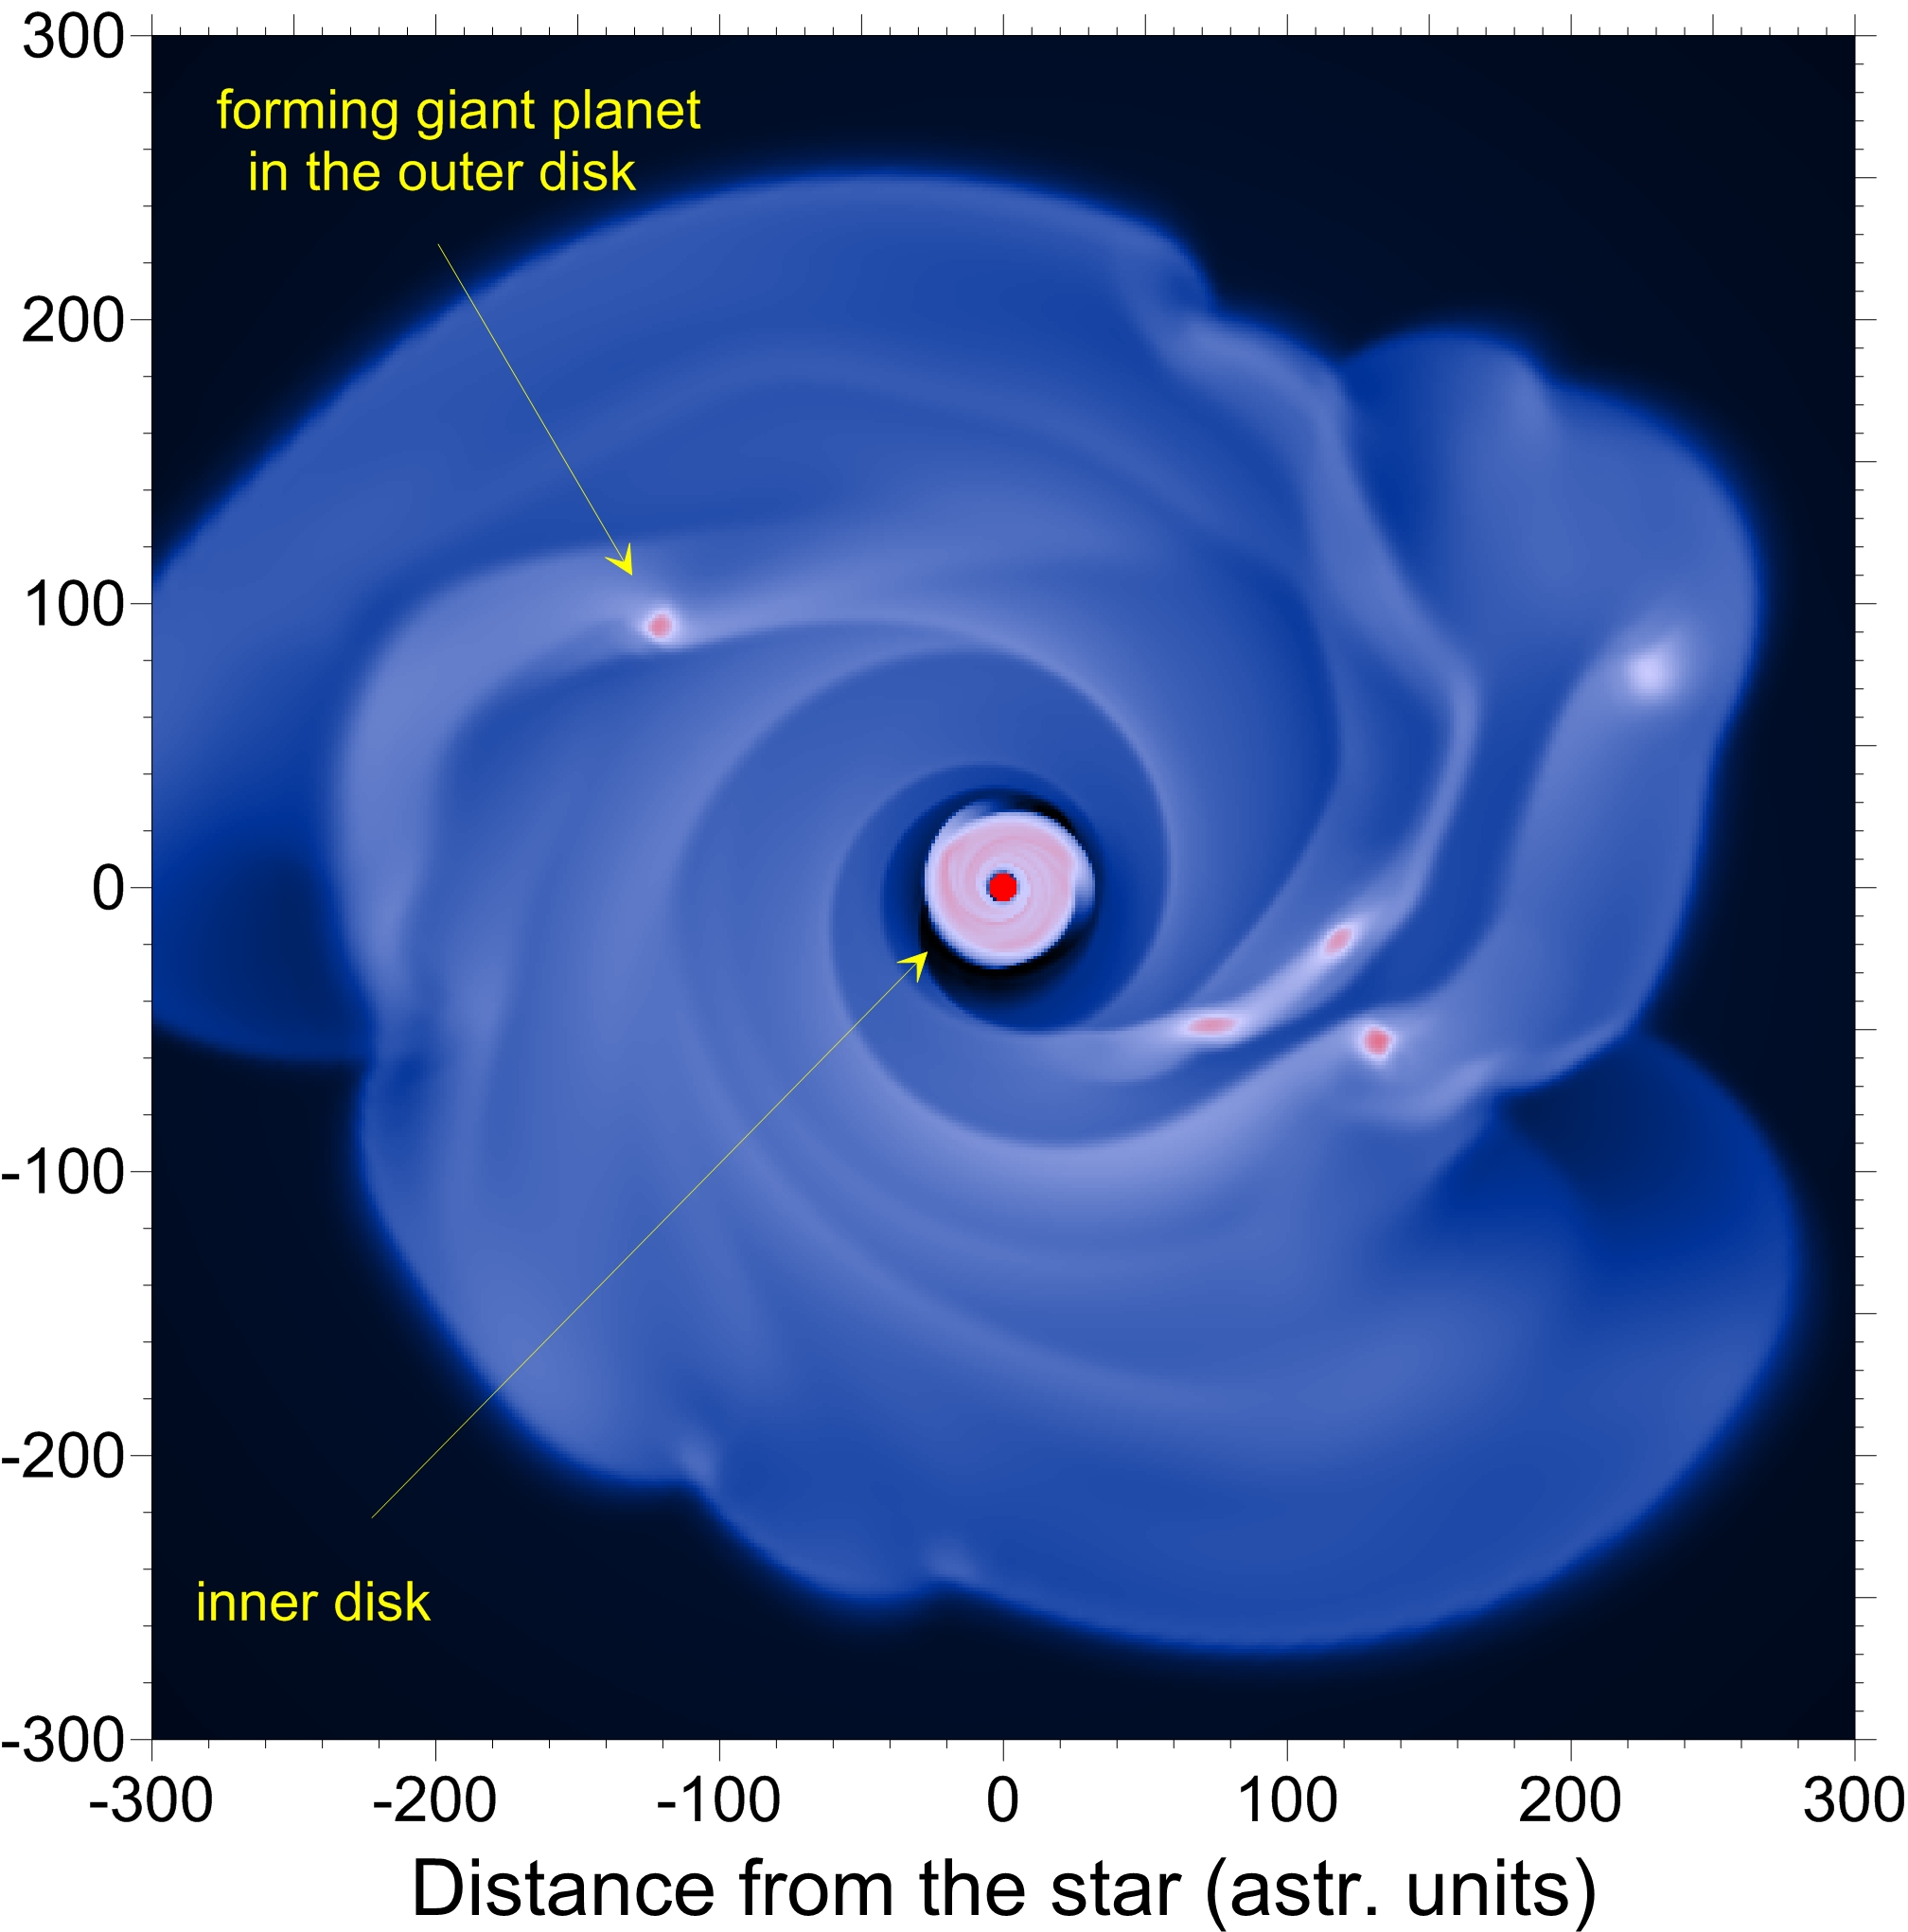
But, there is more. Not long ago, researchers published another paper which appeared in the Astrophysical Journal. Here they made an effort to solve another unanswered riddle about SN1987A. Since 1992 the supernova appears to be “brighter” on one side than it does the other! Dr. Toby Potter, another researcher from ICRAR’s UWA node took on this curiosity by creating a three-dimensional simulation of the expanding supernova shockwave.
“By introducing asymmetry into the explosion and adjusting the gas properties of the surrounding environment, we were able to reproduce a number of observed features from the real supernova such as the persistent one-sidedness in the radio images”, said Dr. Toby Potter.
So what’s going on? By creating a model which spans over a length of time, researchers were able to emulate an expanding shock front along the eastern edge of the supernova remnant. This region moves away more quickly than its counterpart and generates more radio emissions. When it encounters the equatorial ring – as observed by the Hubble Space Telescope – the effect becomes even more pronounced.
A visualization showing how Supernova1987A evolves between May of 1989 and July of 2014. Credit: Dr Toby Potter, ICRAR-UWA, Dr Rick Newton, ICRAR-UWA
“Our simulation predicts that over time the faster shock will move beyond the ring first. When this happens, the lop-sidedness of radio asymmetry is expected to be reduced and may even swap sides.”
“The fact that the model matches the observations so well means that we now have a good handle on the physics of the expanding remnant and are beginning to understand the composition of the environment surrounding the supernova – which is a big piece of the puzzle solved in terms of how the remnant of SN1987A formed.”
Original Story Source: Astronomers dissect the aftermath of a Supernova – International Centre for Radio Astronomy Research News Release.

About Tammy Plotner
Tammy is a professional astronomy author, President Emeritus of Warren Rupp Observatory and retired Astronomical League Executive Secretary. She’s received a vast number of astronomy achievement and observing awards, including the Great Lakes Astronomy Achievement Award, RG Wright Service Award and the first woman astronomer to achieve Comet Hunter's Gold Status.- FASHION WEEK - USA Fashion and Music News
- GOOGLE NEWS - Google News Blogger
- PINTEREST ACROSS THE UNIVERSE - Google Images Nasa Images
- LAST FM - Download Music Legally Direct From Artist
- WOMEN COMMUNITY - Women Communty Photography Videos Beauty
- DISNEY CHANNEL - Photos and Music News
- BABY JUSTIN BIEBER - Google Images Google News
- LADY GAGA - Google Images Google News
- ACROSS THE UNIVERSE - Google Images Universe Pictures
- VICTORIA´S SECRET COMMUNITY - Victoria´s Secret Fashion Show Photos


