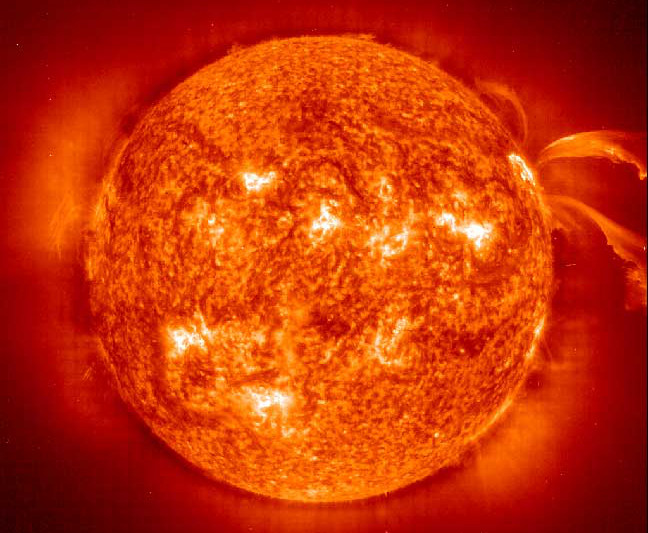
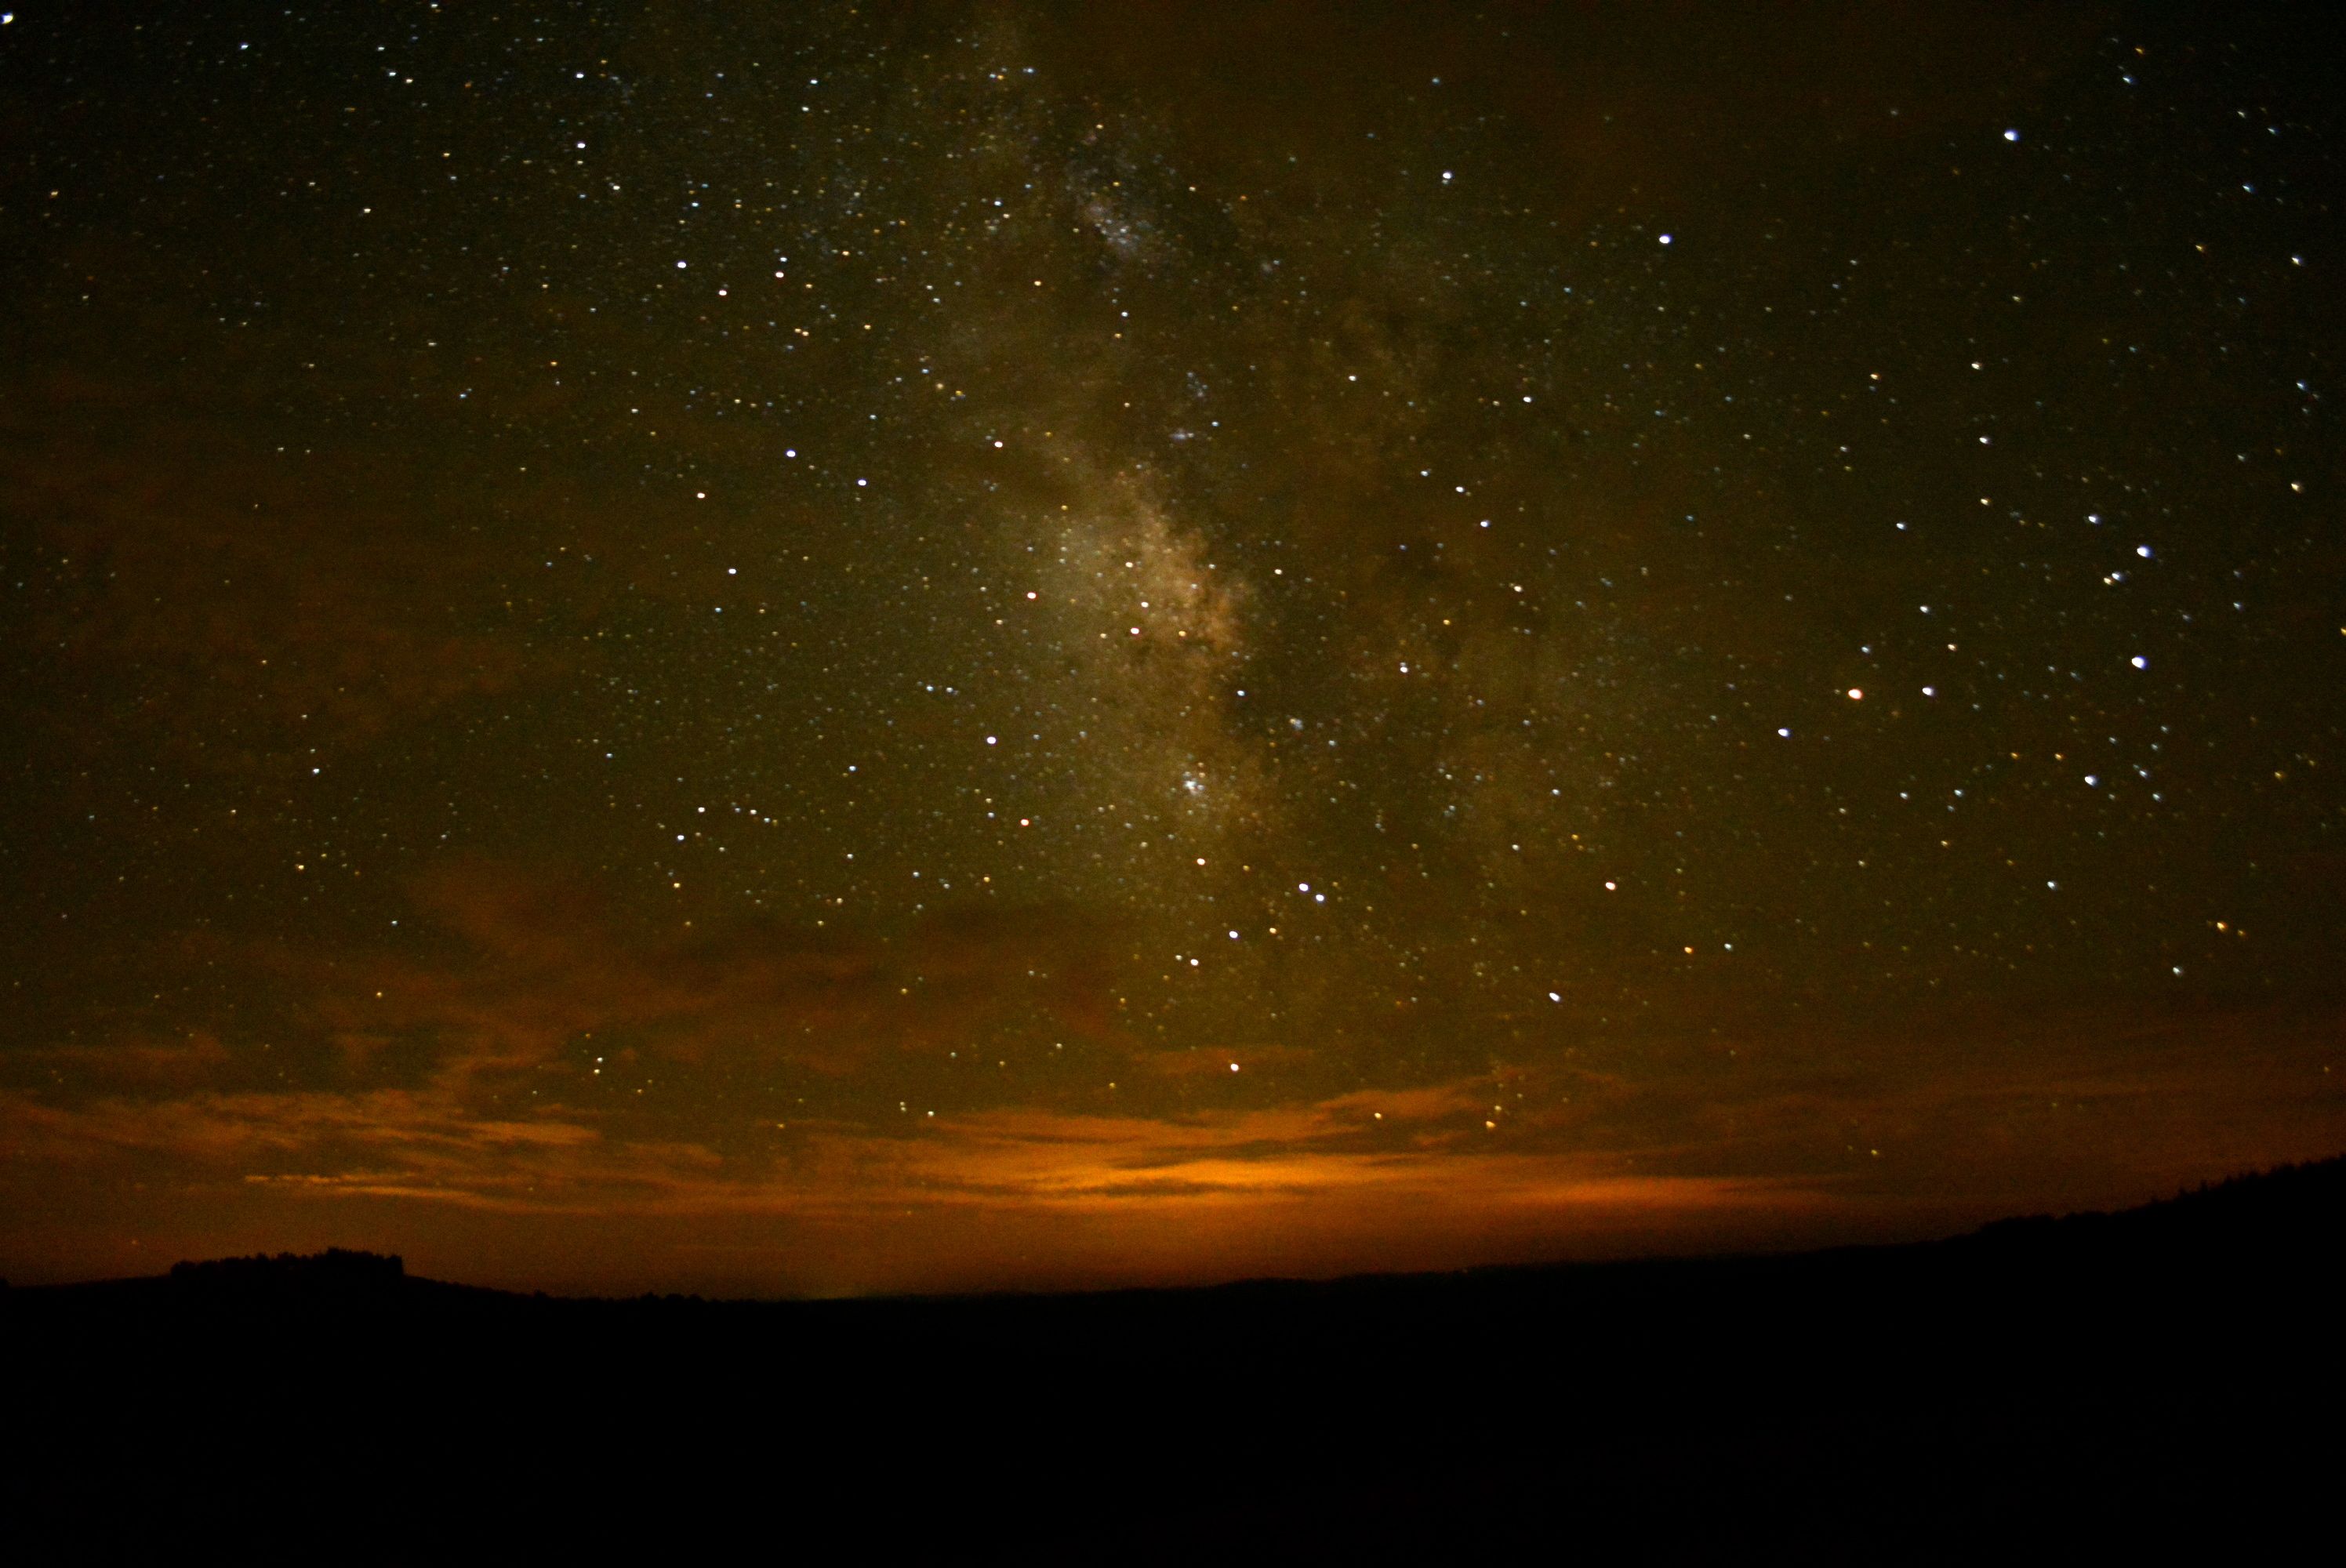
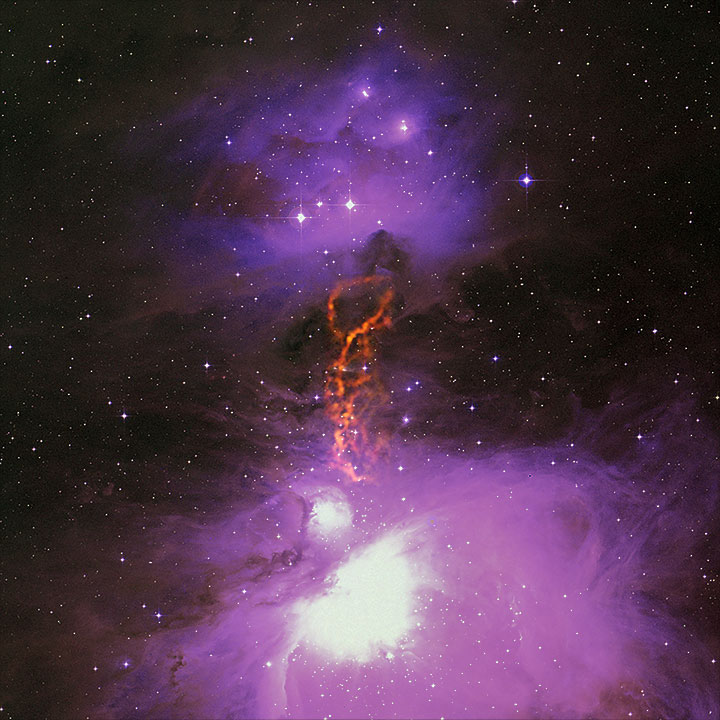
This image from the Solar and Heliospheric Observatory (SOHO) Extreme ultraviolet Imaging Telescope (EIT) shows large magnetically active regions and a pair of curving erupting prominences on June 28, 2000 during the solar cycle 23 maximum. Credit: NASA & European Space Agency (ESA)
Typically astronomers use sunspots to map the course of the solar cycle, but now an international team of astronomers have discovered a new marker: brightpoints, small bright spots in the solar atmosphere that allow us to observe the constant turmoil of material inside the Sun.
The new markers provide a new method in understanding how the Sun’s magnetic field evolves over time, suggesting a deeper and longer cycle.
A well-behaved Sun flips its north and south magnetic poles every 11 years. The cycle begins when the field is weak and dipolar. But the Sun’s rotation is faster at its equator than at its poles, and this difference stretches and tangles the magnetic field lines, ultimately producing sunspots, prominences, and sometimes flares.
“Sunspots have been the perennial marker for understanding the mechanisms that rule the sun’s interior,” said lead author Scott McIntosh, from the National Center for Atmospheric Research, in a news release. “But the processes that make sunspots are not well understood, and far less, those that govern their migration and what drives their movement.”
So McIntosh and colleagues developed a new tracking devise: spots of extreme ultraviolet and X-ray light, known as brightpoints in the Sun’s atmosphere, or corona.
“Now we can see there are bright points in the solar atmosphere, which act like buoys anchored to what’s going on much deeper down,” said McIntosh. “They help us develop a different picture of the interior of the sun.”
McIntosh and colleagues dug through the wealth of data available from the Solar and Heliospheric Observatory and the Solar Dynamics Observatory. They noticed that multiple bands of these markers also move steadily toward the equator over time. But they do so on a different timescale than sunspots.
At solar minimum there might be two bands in the northern hemisphere (one positive and one negative) and two bands in the southern hemisphere (one negative and one positive). Due to their close proximity, bands of opposite charge easily cancel one another, causing the Sun’s magnetic system to be calmer, producing fewer sunspots and eruptions.
But once the two low-latitude bands reach the equator, their polarities cancel each other out and the bands abruptly disappear — a process that takes 19 years on average.
The Sun is now left with just two large bands that have migrated to about 30 degrees latitude. Without the nearby band, the polarities don’t cancel. At this point the Sun’s calm face begins to become violently active as sunspots start to grow rapidly.
Solar maximum only lasts so long, however, because the process of generating a new band of opposite polarity has already begun at high latitudes.
In this scenario, it is the magnetic band’s cycle that truly defines the solar cycle. “Thus, the 11-year solar cycle can be viewed as the overlap between two much longer cycles,” said coauthor Robert Leamon, from Montana State University in Bozeman.
The true test, however, will come with the next solar cycle. McIntosh and colleagues predict that the Sun will enter a solar minimum somewhere in the last half of 2017, and the first sunspots of the next cycle will appear near the end of 2019.
The findings have been published in the Sept. 1 issue of the Astrophysical Journal and are available online.
- FASHION WEEK - USA Fashion and Music News
- GOOGLE NEWS - Google News Blogger
- PINTEREST ACROSS THE UNIVERSE - Google Images Nasa Images
- LAST FM - Download Music Legally Direct From Artist
- WOMEN COMMUNITY - Women Communty Photography Videos Beauty
- DISNEY CHANNEL - Photos and Music News
- BABY JUSTIN BIEBER - Google Images Google News
- LADY GAGA - Google Images Google News
- ACROSS THE UNIVERSE - Google Images Universe Pictures
- VICTORIA´S SECRET COMMUNITY - Victoria´s Secret Fashion Show Photos


