Saturday, August 26, 2017

The Moving Martian Bow Shock

The Moving Martian Bow Shock:


The moving Martian bow shock. Credit: ESA/ATG medialab


As the energetic particles of the solar wind speed across interplanetary space, their motion is modified by objects in their path. A study, based on data from ESA's Mars Express orbiter, has thrown new light on a surprising interaction between the planet Mars and supersonic particles in the solar wind.

Scientists have long been aware that a feature known as a bow shock forms upstream of a planet – rather like the bow of a ship, where the water is slowed and then diverted around the obstacle.

The bow shock marks a fairly sharp boundary where the solar wind slows suddenly as it begins to plough into a planet's magnetosphere or outer atmosphere.

In the case of Mars, which does not generate a global magnetic field and has a thin atmosphere, the main obstacle to the solar wind is the ionosphere – a region of electrically charged particles in its upper atmosphere.

Furthermore, the relatively small size, mass and gravity of Mars enable the formation of an extended exosphere – the outermost layer of the atmosphere, where gaseous atoms and molecules escape into space and interact directly with the solar wind.

Observations made by numerous spacecraft over many decades have shown that variations in the ionosphere and exosphere play a role in changes in the location of the bow shock boundary.

As expected, the distance of the Martian bow shock from the planet increases as the dynamic pressure of the solar wind decreases. This is rather like a weakening of the bow wave ahead of a ship as the water's flow slows down.

On the other hand, increases in the distance of the Martian bow shock coincide with increases in the amount of incoming solar radiation at extreme ultraviolet (EUV) wavelengths. Consequently, the rate at which ions and electrons are produced from atoms and molecules in the upper atmosphere increases. This results in increased thermal pressure within the ionosphere, enabling it to better counteract the incoming solar wind flow.

At the same time, newly created ions within the extended exosphere are picked up and accelerated by the electromagnetic fields carried by the solar wind. The result is a slowdown in the solar wind and a shift in the position of the bow shock.

Another possible factor in influencing the bow shock's location is the orbit of Mars. The planet's distance from the Sun is much more elliptical than that of Earth, ranging from 206 million km to 249 million km – a 20% difference.

A team of European scientists has investigated how and why the bow shock's location varies during the Martian year. In a paper published online in the 21 November 2016 issue of the Journal of Geophysical Research: Space Physics, the team has analysed more than five Martian years of measurements from the Mars Express Analyser of Space Plasma and EneRgetic Atoms (ASPERA-3) Electron Spectrometer (ELS) to identify 11 861 bow shock crossings. This is the first analysis of the bow shock to be based on data obtained over such a prolonged period and during all Martian seasons.

As Mars Express crosses the Martian bow shock the ELS instrument typically registers a sudden increase in flux of electrons across a wide range of energies (typically up to a few hundred eV).

The scientists discovered that, on average, the bow shock is closer to Mars near aphelion (the planet's furthest point from the Sun), and further away from Mars near perihelion (the planet's closest point to the Sun). The bow shock's average distance from Mars, when measured from above the terminator (the day-night boundary) reaches a minimum of 8102 km around aphelion, while its maximum distance of 8984 km occurs around perihelion. This is an overall variation of approximately 11% during each Martian orbit.

The team also verified previous findings that the bow shock in the southern hemisphere is, on average, located farther away from Mars than in the northern hemisphere. However, this hemispherical asymmetry is small (a total distance variation of 2.4%), and the same annual variations in the bow shock occur irrespective of the hemisphere.

Solar wind density (and, therefore, dynamic pressure), the strength of the interplanetary magnetic field, and solar irradiation, are all expected to reduce with distance from the Sun. Since these parameters impact the bow shock location in different ways, the team wanted to find out which is the dominant factor throughout the Martian year.

Their somewhat surprising discovery was that the bow shock's location is more sensitive to variations in the solar EUV output than to solar wind dynamic pressure variations.

This may be largely due to the well recognized impact of EUV on the density and thermal pressure of the ionosphere, and the expansion of the exosphere (see above). These processes create buffers against the solar wind.

However, the variations in bow shock distance also correlate with annual changes in the amount of dust in the Martian atmosphere. The Martian dust storm season occurs around perihelion, when the planet is warmer and receives more solar radiation.

"Dust storms have been previously shown to interact with the upper atmosphere and ionosphere of Mars, so there may be an indirect coupling between the dust storms and bow shock location," said Benjamin Hall, lead author of the paper, who was until recently at the University of Leicester, and is currently a researcher at Lancaster University, UK.

"However, we do not draw any further conclusions on how the dust storms could directly impact the location of the Martian bow shock and leave such an investigation to a future study.

"It seems likely that no single mechanism can explain our observations, but rather a combined effect of all of them. At this point none of them can be excluded.

"Future investigations of links between atmospheric dust loading and the Martian upper atmosphere are needed, involving joint investigations by ESA's Mars Express and Trace Gas Orbiter, and NASA's MAVEN mission. Early data from MAVEN seem to confirm the trends that we discovered."

"Similar investigations were made by the ASPERA instrument that was flown on board the Venus Express orbiter, enabling us to compare physical processes and conditions at two very different planets that both have weak magnetic fields," said Dmitri Titov, ESA's Mars Express Project Scientist.

"This demonstrates the value of using the same instrumentation to explore different worlds."

Credit: ESA

Dino-Killing Asteroid Could Have Thrust Earth into Two Years of Darkness

Dino-Killing Asteroid Could Have Thrust Earth into Two Years of Darkness:


An illustration of an asteroid impacting Earth. (Image courtesy NASA.)


Tremendous amounts of soot, lofted into the air from global wildfires following a massive asteroid strike 66 million years ago, would have plunged Earth into darkness for nearly two years, new research finds. This would have shut down photosynthesis, drastically cooled the planet, and contributed to the mass extinction that marked the end of the age of dinosaurs.

These new details about how the climate could have dramatically changed following the impact of a 10-kilometer-wide asteroid will be published Aug. 21 in the Proceedings of the National Academy of Sciences. The study, led by the National Center for Atmospheric Research (NCAR) with support from NASA and the University of Colorado Boulder, used a world-class computer model to paint a rich picture of how Earth’s conditions might have looked at the end of the Cretaceous Period, information that paleobiologists may be able to use to better understand why some species died, especially in the oceans, while others survived.

Scientists estimate that more than three-quarters of all species on Earth, including all non-avian dinosaurs, disappeared at the boundary of the Cretaceous-Paleogene periods, an event known as the K-Pg extinction. Evidence shows that the extinction occurred at the same time that a large asteroid hit Earth in what is now the Yucatán Peninsula. The collision would have triggered earthquakes, tsunamis, and even volcanic eruptions.

Scientists also calculate that the force of the impact would have launched vaporized rock high above Earth's surface, where it would have condensed into small particles known as spherules. As the spherules fell back to Earth, they would have been heated by friction to temperatures high enough to spark global fires and broil Earth's surface. A thin layer of spherules can be found worldwide in the geologic record.

"The extinction of many of the large animals on land could have been caused by the immediate aftermath of the impact, but animals that lived in the oceans or those that could burrow underground or slip underwater temporarily could have survived," said NCAR scientist Charles Bardeen, who led the study. "Our study picks up the story after the initial effects — after the earthquakes and the tsunamis and the broiling. We wanted to look at the long-term consequences of the amount of soot we think was created and what those consequences might have meant for the animals that were left."

Other study co-authors are Rolando Garcia and Andrew Conley, both NCAR scientists, and Owen “Brian” Toon, a researcher at the University of Colorado Boulder.

In past studies, researchers have estimated the amount of soot that might have been produced by global wildfires by measuring soot deposits still preserved in the geologic record. For the new study, Bardeen and his colleagues used the NCAR-based Community Earth System Model (CESM) to simulate the effect of the soot on global climate going forward. They used the most recent estimates of the amount of fine soot found in the layer of rock left after the impact (15,000 million tons), as well as larger and smaller amounts, to quantify the climate's sensitivity to more or less extensive fires.

In the simulations, soot heated by the Sun was lofted higher and higher into the atmosphere, eventually forming a global barrier that blocked the vast majority of sunlight from reaching Earth's surface. “At first it would have been about as dark as a moonlit night," Toon said.

While the skies would have gradually brightened, photosynthesis would have been impossible for more than a year and a half, according to the simulations. Because many of the plants on land would have already been incinerated in the fires, the darkness would likely have had its greatest impact on phytoplankton, which underpin the ocean food chain. The loss of these tiny organisms would have had a ripple effect through the ocean, eventually devastating many species of marine life.

The research team also found that photosynthesis would have been temporarily blocked even at much lower levels of soot. For example, in a simulation using only 5,000 million tons of soot — about a third of the best estimate from measurements — photosynthesis would still have been impossible for an entire year.

In the simulations, the loss of sunlight caused a steep decline in average temperatures at Earth's surface, with a drop of 50 degrees Fahrenheit (28 degrees Celsius) over land and 20 degrees Fahrenheit (11 degrees Celsius) over the oceans.

While Earth's surface cooled in the study scenarios, the atmosphere higher up in the stratosphere actually became much warmer as the soot absorbed light from the Sun. The warmer temperatures caused ozone destruction and allowed for large quantities of water vapor to be stored in the upper atmosphere. The water vapor then chemically reacted in the stratosphere to produce hydrogen compounds that led to further ozone destruction. The resulting ozone loss would have allowed damaging doses of ultraviolet light to reach Earth's surface after the soot cleared.

The large reservoir of water in the upper atmosphere formed in the simulations also caused the layer of sunlight-blocking soot to be removed abruptly after lingering for years, a finding that surprised the research team. As the soot began to settle out of the stratosphere, the air began to cool. This cooling, in turn, caused water vapor to condense into ice particles, which washed even more soot out of the atmosphere. As a result of this feedback loop — cooling causing precipitation that caused more cooling — the thinning soot layer disappeared in just a few months.

While the scientists think the new study gives a robust picture of how large injections of soot into the atmosphere can affect the climate, they also caution that the study has limitations.

For example, the simulations were run in a model of modern-day Earth, not a model representing what Earth looked like during the Cretaceous Period, when the continents were in slightly different locations. The atmosphere 66 million years ago also contained somewhat different concentrations of gases, including higher levels of carbon dioxide.

Additionally, the simulations did not try to account for volcanic eruptions or sulfur released from the Earth's crust at the site of the asteroid impact, which would have resulted in an increase in light-reflecting sulfate aerosols in the atmosphere.

The study also challenged the limits of the computer model's atmospheric component, known as the Whole Atmosphere Community Climate Model (WACCM).

"An asteroid collision is a very large perturbation — not something you would normally see when modeling future climate scenarios," Bardeen said. "So the model was not designed to handle this and, as we went along, we had to adjust the model so it could handle some of the event's impacts, such as warming of the stratosphere by over 200 degrees Celsius."

These improvements to WACCM could be useful for other types of studies, including modeling a "nuclear winter" scenario. Like global wildfires millions of years ago, the explosion of nuclear weapons could also inject large amounts of soot into the atmosphere, which could lead to a temporary global cooling.

"The amount of soot created by nuclear warfare would be much less than we saw during the K-Pg extinction," Bardeen said. "But the soot would still alter the climate in similar ways, cooling the surface and heating the upper atmosphere, with potentially devastating effects."

Credit: ucar.edu

Best Ever Image of a Star’s Surface and Atmosphere

Best Ever Image of a Star’s Surface and Atmosphere:


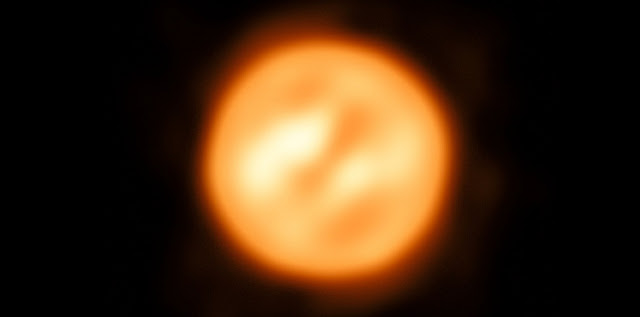
Using ESO’s Very Large Telescope Interferometer astronomers have constructed this remarkable image of the red supergiant star Antares. This is the most detailed image ever of this object, or any other star apart from the Sun.  Credit: ESO/K. Ohnaka


Using ESO’s Very Large Telescope Interferometer astronomers have constructed the most detailed image ever of a star — the red supergiant star Antares. They have also made the first map of the velocities of material in the atmosphere of a star other than the Sun, revealing unexpected turbulence in Antares’s huge extended atmosphere. The results were published in the journal Nature.

To the unaided eye the famous, bright star Antares shines with a strong red tint in the heart of the constellation of Scorpius (The Scorpion). It is a huge and comparatively cool red supergiant star in the late stages of its life, on the way to becoming a supernova.

A team of astronomers, led by Keiichi Ohnaka, of the Universidad Católica del Norte in Chile, has now used ESO’s Very Large Telescope Interferometer (VLTI) at the Paranal Observatory in Chile to map Antares’s surface and to measure the motions of the surface material. This is the best image of the surface and atmosphere of any star other than the Sun.

The VLTI is a unique facility that can combine the light from up to four telescopes, either the 8.2-meter Unit Telescopes, or the smaller Auxiliary Telescopes, to create a virtual telescope equivalent to a single mirror up to 200 metes across. This allows it to resolve fine details far beyond what can be seen with a single telescope alone.

“How stars like Antares lose mass so quickly in the final phase of their evolution has been a problem for over half a century,” said Keiichi Ohnaka, who is also the lead author of the paper. “The VLTI is the only facility that can directly measure the gas motions in the extended atmosphere of Antares — a crucial step towards clarifying this problem. The next challenge is to identify what’s driving the turbulent motions.”

Using the new results the team has created the first two-dimensional velocity map of the atmosphere of a star other than the Sun. They did this using the VLTI with three of the Auxiliary Telescopes and an instrument called AMBER to make separate images of the surface of Antares over a small range of infrared wavelengths. The team then used these data to calculate the difference between the speed of the atmospheric gas at different positions on the star and the average speed over the entire star. This resulted in a map of the relative speed of the atmospheric gas across the entire disc of Antares — the first ever created for a star other than the Sun.

The astronomers found turbulent, low-density gas much further from the star than predicted, and concluded that the movement could not result from convection, that is, from large-scale movement of matter which transfers energy from the core to the outer atmosphere of many stars. They reason that a new, currently unknown, process may be needed to explain these movements in the extended atmospheres of red supergiants like Antares.

“In the future, this observing technique can be applied to different types of stars to study their surfaces and atmospheres in unprecedented detail. This has been limited to just the Sun up to now,” concludes Ohnaka. “Our work brings stellar astrophysics to a new dimension and opens an entirely new window to observe stars.”

Credit: ESO

Black Holes: Scientists 'Excited' by Observations Suggesting Formation Scenarios

Black Holes: Scientists 'Excited' by Observations Suggesting Formation Scenarios:


A black hole within the Milky Way Galaxy. Photo Credit: Wikimedia Commons


Physicists have described how observations of gravitational waves limit the possible explanations for the formation of black holes outside of our galaxy; either they are spinning more slowly than black holes in our own galaxy or they spin rapidly but are ‘tumbled around’ with spins randomly oriented to their orbit. The paper, published in Nature, is based on data that came about following landmark observations of gravitational waves by the LIGO gravitational wave detector in 2015 and again in 2017.

In our own galaxy we have been able to electromagnetically observe black holes orbited by stars and map their behavior – notably their rapid spinning.

Gravitational waves carry information about the dramatic origins of black that cannot otherwise be obtained. Physicists concluded that the first detected gravitational waves, in September 2015, were produced during the final fraction of a second of the merger of two black holes to produce a single, more massive spinning black hole. Collisions of two black holes had been predicted, but never observed.

As such, gravitational waves present the best and only way to get a deep look at the population of stellar-mass binary black holes beyond our galaxy. This paper states that the black holes seen via gravitational waves are different to those previously seen in our galaxy in one of two possible ways.

The first possibility is that the black holes are spinning slowly. If that is the case it suggests that something different is happening to the stars that form these black holes than those observed in our galaxy.

The second possibility is that the black holes are spinning rapidly, much like those in our galaxy, but have been ‘tumbled’ during formation and are therefore no longer aligned with orbit. If this is the case, it would mean that the black holes are living in a dense environment – most likely within star clusters. That would make for a considerably more dynamic formation.

There is, however, also the chance that both possibilities are true – that there are instances of black holes spinning slowly in the field and instances of black holes spinning rapidly in a dense environment.

Dr Will Farr, from the School of Physics and Astronomy at the University of Birmingham, explained, “By presenting these two explanations for the observed behavior, and ruling out other scenarios, we are providing those who study and try to explain the formation of black holes a target to hit. In our field, knowing the question to ask is almost as important as getting the answer itself.”

Professor Ilya Mandel, also from the University of Birmingham, added “We will know which explanation is right within the next few years. This is something that has only been made possible by the recent LIGO detections of gravitational waves. This field is in its infancy; I’m confident that in the near future we will look back on these first few detections and rudimentary models with nostalgia and a much better understanding of how these exotic binary systems form.”

The team was led by researchers from the University of Birmingham in the UK alongside the University of Maryland, University of Chicago and Kavli Institute for Theoretical Physics in the US.

Scientists Detect First X-rays from Mystery Supernovas

Scientists Detect First X-rays from Mystery Supernovas:


An image showing X-rays detected from the supernova 2012ca (inside the circle). Image has been smoothed and colorized. Photo by Vikram Dwarkadas/Chandra X-ray Observatory


Exploding stars lit the way for our understanding of the universe, but researchers are still in the dark about many of their features. A team of scientists, including scholars from the University of Chicago, appear to have found the first X-rays coming from type Ia supernovas. Their findings are published online Aug. 23 in the Monthly Notices of the Royal Astronomical Society.

Astronomers are fond of type Ia supernovas, created when a white dwarf star in a two-star system undergoes a thermonuclear explosion, because they burn at a specific brightness. This allows scientists to calculate how far away they are from Earth, and thus to map distances in the universe. But a few years ago, scientists began to find type Ia supernovas with a strange optical signature that suggested they carried a very dense cloak of circumstellar material surrounding them.

Such dense material is normally only seen from a different type of supernova called type II, and is created when massive stars start to lose mass. The ejected mass collects around the star; then, when the star collapses, the explosion sends a shockwave hurtling at supersonic speeds into this dense material, producing a shower of X-rays. Thus we regularly see X-rays from type II supernovas, but they have never been seen from type Ia supernovas.

When the UChicago-led team studied the supernova 2012ca, recorded by the Chandra X-ray Observatory, however, they detected X-ray photons coming from the scene.

“Although other type Ia’s with circumstellar material were thought to have similarly high densities based on their optical spectra, we have never before detected them with X-rays,” said study co-author Vikram Dwarkadas, research associate professor in the Department of Astronomy and Astrophysics.

The amounts of X-rays they found were small—they counted 33 photons in the first observation a year and a half after the supernova exploded, and ten in another about 200 days later—but present.

“This certainly appears to be a Ia supernova with substantial circumstellar material, and it looks as though it’s very dense,” he said. “What we saw suggests a density about a million times higher what we thought was the maximum around Ia’s.”

It’s thought that white dwarfs don’t lose mass before they explode. The usual explanation for the circumstellar material is that it would have come from a companion star in the system, but the amount of mass suggested by this measurement was very large, Dwarkadas said—far larger than one could expect from most companion stars. “Even the most massive stars do not have such high mass-loss rates on a regular basis,” he said. “This once again raises the question of how exactly these strange supernovas form.”

“If it’s truly a Ia, that’s a very interesting development because we have no idea why it would have so much circumstellar material around it,” he said.

“It is surprising what you can learn from so few photons,” said lead author and Caltech graduate student Chris Bochenek; his work on the study formed his undergraduate thesis at UChicago. “With only tens of them, we were able to infer that the dense gas around the supernova is likely clumpy or in a disk.”

More studies to look for X-rays, and even radio waves coming off these anomalies, could open a new window to understanding such supernovas and how they form, the authors said.

Credit: uchicago.edu

Study Captures Science Data from Great American Eclipse

Study Captures Science Data from Great American Eclipse:


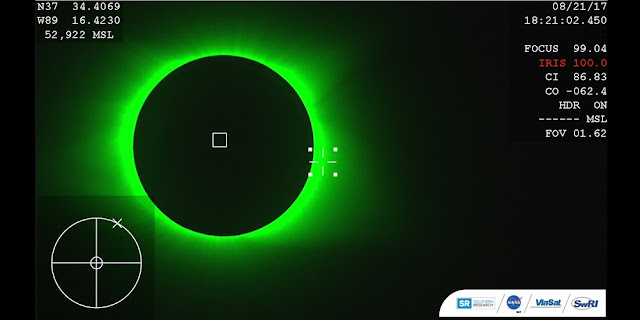
Both stabilized telescopes aboard the WB-57F aircraft successfully acquired science data and images during the August 21 eclipse, including observations of the solar corona during eclipse totality and of Mercury during the eclipse partial phase. Initial analysis of the data has begun, with results expected to be available over the coming months. Image courtesy of NASA


Two NASA WB-57F research aircraft successfully tracked the August 21 solar eclipse as part of a NASA project led by Southwest Research Institute (SwRI) to study the solar corona and Mercury’s surface. “The visible and infrared data look spectacular,” said SwRI senior research scientist Dr. Amir Caspi, principal investigator of the project. “We’re already seeing some surprising features, and we are very excited to learn what the detailed analysis will reveal.”

The team began initial analysis of the data gathered during the flights, showing clear images of the Sun’s outer atmosphere and thermal images of Mercury’s surface. Initial results are expected to be released in a few months and presented at the fall meeting of the American Geophysical Union in December 2017.

Total solar eclipses are unique opportunities for scientists to study the hot atmosphere above the Sun’s visible surface. The faint light from the corona is usually overpowered by intense emissions from the Sun itself. During a total eclipse, however, the Moon blocks the glare from the bright solar disk and darkens the sky, allowing weaker coronal emissions to be observed.

“This is the best observed eclipse ever,” said Dr. Dan Seaton, co-investigator of the project from the University of Colorado. “With the results from the WB-57s and complementary observations from space and other experiments on the ground, we have an opportunity to answer some of the most fundamental questions about the nature of the corona.”

The eclipse also provided an opportunity for scientists to study Mercury, which is notoriously difficult to image because of its proximity to the Sun. “The infrared images of Mercury were much brighter than we originally expected,” said Caspi. Using infrared observations in near darkness through very little atmosphere, the team received data enabling it, for the first time, to attempt to estimate the surface temperature distribution over the planet’s night side. “It will be incredibly interesting to dig into these data,” said Dr. Constantine Tsang, SwRI senior research scientist and a co-investigator on the project.

The team used stabilized telescopes with sensitive, high-speed, visible-light and infrared cameras aboard the research aircraft from an altitude of 50,000 feet, providing a significant advantage over ground-based observations. These are the first astronomical observations for the Houston-based WB-57Fs. Southern Research, of Birmingham, Ala., built the Airborne Imaging and Recording Systems (AIRS) and worked with the scientific team to upgrade its DyNAMITE telescopes onboard the planes with solar filters and improved data recorders and operating software.

“The pilots, instrument operators, and engineers did a phenomenal job getting us exactly the data we asked for,” said Caspi. “Achieving this quality of measurement required an enormous effort and precise timing, and everyone hit their mark exactly. I am honored to be part of such an exceptionally talented and professional team, and grateful for everyone’s dedication and hard work.”

The SwRI-led team includes scientists from the University of Colorado, the National Center for Atmospheric Research High Altitude Observatory, and the Smithsonian Astrophysical Observatory, as well as international colleagues at Trinity College Dublin in Ireland and the Royal Observatory of Belgium.

Credit: swri.org

Phoenicid Meteor Shower from Dead Comet Arises Again After 58 Years

Phoenicid Meteor Shower from Dead Comet Arises Again After 58 Years:


A bright member of the Phoenicid meteor shower appears at the bottom left of this photo taken at 02h15m39s UT on December 2, 2014. The Moon is captured to the lower right of center in the photo. Camera: Pentax K-3 + SIGMA 4.5mm F2.8, 3 second exposure time, at Sandy Point, North Carolina, U.S.A.. (Photo: Hiroyuki Toda)


The Phoenicid meteor shower (named after the constellation Phoenix) was discovered by the first Japanese Antarctic Research Expedition on December 5, 1956, during their voyage in the Indian Ocean. However, it has not been observed again. This has left astronomers with a mystery: where did the Phoenicids come from and where did they go?

Two Japanese teams have found an answer to these questions by linking the Phoenicid meteor shower to a vanished celestial body, Comet Blanpain. This comet appeared in 1819 for the first time and then disappeared. In 2003 astronomers discovered a minor body moving along the same orbit as Comet Blanpain had over 100 years ago and showed that it was the remains of Comet Blanpain. The iconic coma and tail of a comet are made of gas and dust which escaped from the surface of the nucleus. The reason why Comet Blanpain reappeared as an asteroid was probably because all the gas and dust have escaped from this central body. Now rather than calling the object a "comet" it might be more accurate to refer to it as an "asteroid."

Although all of the gas and dust have escaped from Comet Blanpain into space, they now form a dust trail which revolves along almost the same orbit as Comet Blanpain itself, and gradually spread along the orbit. When such a dust trail encounters the Earth, the dust particles impinge into the atmosphere and ablate, which are observed as meteors.

Assuming that Comet Blanpain is the parent body of the Phoenicids, the teams performed calculations and predicted that the Phoenicids should be observed again on December 1, 2014. Following this prediction, the two teams of Japanese astronomers carried out a campaign of observation. One team led by Yasunori Fujiwara, a graduate student at the Department of Polar Science, SOKENDAI (The Graduate University for Advanced Studies), and Takuji Nakamura, a professor of the National Institute of Polar Research/SOKENDAI, traveled to North Carolina, U.S.A., and observed there. The other team led by Mikiya Sato, an astronomical officer at Kawasaki Municipal Science Museum, and Junichi Watanabe, a professor of the National Astronomical Observatory of Japan/SOKENDAI, visited La Palma Island in the Spanish territory off the West coast of Africa for observations. The weather condition at the former site was comparatively good, but more clouds covered at the latter site. Therefore, Sato's team supplementary used data from other sources such as NASA's All Sky Fireball Network and radar observations at the University of Western Ontario, Canada.

Just because meteors appeared, doesn't mean they are part of the Phoenicid meteor shower; Earth is bombarded by a constant background of sporadic meteors every night. In order to distinguish Phoenicids from sporadic meteors, both teams analyzed the data, by back-tracing each meteor trail to distinguish the meteor shower. If many meteors come from the same point in the sky, then they are part of the same meteor shower. Out of the 138 meteors observed at North Carolina, 29 were identified as Phoenicids. The Phoenicid activity peaked between 8 pm to 9 pm local time, very close to the predicted peak of the Phoenicid meteor shower, which was 7 pm to 8 pm. This fact has further supported that the observed meteors back-traced to the Phoenicid radiant are surely from Phoenicid meteor shower. The data collected by the other sources also supported this result.

But not everything matched the predictions. One discrepancy between the prediction and the observations was that the number of Phoenicids observed was only 10% of the prediction. This indicates that Comet Blanpain was active, but only to a limited extent when the observed meteors were released from the comet when it approached the Sun in the early 20th Century. To summarize, the observed meteor shower is the first example for the astronomers where the evolution of a comet has been estimated. Fujiwara enthusiastically states, "we would like to apply this technique to many other meteor showers for which the parent bodies are currently without clear cometary activities, in order to investigate the evolution of minor bodies in the Solar System."

Fujiwara's research is being published in the "Publications of the Astronomical Society of Japan," and Sato's research will appear in the journal "Planetary and Space Science" very soon.

Credit: soken.ac.jp

Bold Space Travel

Bold Space Travel:


Illustration of a laser-propelled miniature spaceship devised by UCSB physicist Philip Lubin.   Photo Credit: COURTESY PHOTO


Transforming science fiction to reality, physics professor Philip Lubin is creating a laser-cannon system to propel miniature spaceships with solar sails more than 25 trillion miles to the sun’s nearest star — Proxima Centuari. Loaded with cameras, other sensors, historical records of humanity, greetings from Earth and possibly human DNA, the smartphone-sized crafts, or interstellar arks, would be thrust on an historic journey that would take about 20 years — a blink of an eye in space travel.

“People understood roughly 100 years ago that it was possible using then-technology to send a human to the moon and return them,” Lubin said, noting that one challenge was scaling down equipment. “If you look at the popular literature at that time, the idea was treated as science fiction, like Flash Gordon.”

Lubin’s ambitious vision is showcased in “Laser-Sailing Starships,” one of eight volumes in the new series “Out of this World” published by World Book (of encyclopedia fame). Targeted to middle-school students, the books focus on research fellows involved in the NASA Innovative Advanced Concepts program. NASA aims to foster the next generation of scientific talent.

“The great part about the whole series is that it doesn’t talk down to kids, but addresses the science head-on,” said Jason Derleth, the program executive for NASA, which helps fund Lubin’s research.

In 2009, Lubin began examining how to use directed energy — a phased laser array — to deflect asteroids bound for Earth. But there was limited outside interest in the UCSB research, he said, because the planet doesn’t get hit often. 

That changed dramatically in 2013. Lubin and his team had been focused on the expected near-Earth flyby of the DA14 asteroid (about 17,000 miles away). However, only hours before the asteroid was scheduled to pass the planet, Russia was struck by the Chelyabinsk meteor with the force of strategic nuclear bomb. The event directed worldwide media attention on Lubin and his team of student researchers in the Department of Physics.

“I woke up the next day and someone called to tell me Russia got hit with a meteor — I thought they were joking,” Lubin said. “At that point, things kind of went nuts. That singular event was completely coincidental — there was no relationship between the two cosmic events.”

Amid the recognition, Lubin’s concept presented in earlier research — using his asteroid-deflection technology to provide relativistic-speed propulsion for an interstellar mission — captured the attention of NASA and the United States Congress. In separate meetings with the space agency and legislators, Lubin described launching hundreds of the tiny crafts in the hope one or more reaches Proxima Centuari — a red dwarf about one-eighth the sun’s size. 

“A large number of scientists have looked at the technical paper we wrote in 2015 on how to accomplish this,” Lubin said. “Except for saying this is going to be hard to do, no one has found a fatal flaw.”

Credit: ucsb.edu

The Puzzle of Ultra-Diffuse Galaxies

The Puzzle of Ultra-Diffuse Galaxies:


A gallery of several ultra-diffuse galaxies discovered in the Perseus galaxy cluster. These objects are barely visible against the background. Diffuse bright spots are foreground stars in the Milky Way. Credit: Carolin Wittmann (ZAH).


Our solar system is located in a spiral galaxy composed of billions of stars, the Milky Way. With the naked eye, we can see some 3000 stars in a dark night. However, if Earth would reside within an ultra-diffuse galaxy, we would only spot a few dozen stars on the sky. Galaxies of this type were either not able to produce more stars in the first place, or they got stripped of their stars by tidal forces.

Intriguingly, though, larger telescopes and improved imaging techniques have recently led to the discovery of many ultra-diffuse galaxies in the harshest environments possible: galaxy clusters.

"We have been asking ourselves how these fragile objects are able to survive among such dense, massive accumulations of hundreds of large and small galaxies", explains Carolin Wittmann, PhD student at the Astronomisches Rechen-Institut (ARI) of the Zentrum für Astronomie der Universität Heidelberg (ZAH). Using very deep optical images obtained in 2012 with the Prime Focus Camera (PFIP) of the William Herschel Telescope (WHT), Ms Wittmann identified about 90 such galaxies in the core of the Perseus Cluster, 240 million light-years away. 

Astronomers wonder how these vulnerable galaxies are able to survive among such dense, massive accumulations of hundreds of large and small galaxies. Are they possibly protected by a high dark matter content? Or might they be just now in the process of tidal disruption?

"Surprisingly, most galaxies appear intact — only very few show signs of ongoing disruption," emphasizes Dr Thorsten Lisker, who initiated the project. If this means that the ultra-diffuse galaxies can withstand the strong tidal field of the Perseus Cluster, then they must contain a large amount of unseen mass—dark matter—whose gravitational attraction acts as a binding force. 

Tidal forces may, however, be the reason why galaxies with the largest sizes are not found in the Perseus cluster core, while being present in the outer regions of other galaxy clusters. Along with international partners, the researchers are now hoping to obtain data of similar quality on the outskirts of the Perseus Cluster, where the environmental influence would have been less strong, preserving more of the original structure of the galaxies.

Credit: ing.iac.es

Kepler Spacecraft Discovers Variability in the Seven Sisters

Kepler Spacecraft Discovers Variability in the Seven Sisters:


This image from NASA’s Kepler spacecraft shows members of the Pleiades star cluster taken during Campaign 4 of the K2 Mission. The cluster stretches across two of the 42 charge-coupled devices (CCDs) that make up Kepler’s 95 megapixel camera. The brightest stars in the cluster – Alcyone, Atlas, Electra, Maia, Merope, Taygeta, and Pleione – are visible to the naked eye. Kepler was not designed to look at stars this bright; they cause the camera to saturate, leading to long spikes and other artefacts in the image. Despite this serious image degradation, the new technique has allowed astronomers to carefully measure changes in brightness of these stars as the Kepler telescope observed them for almost three months. Credit: NASA / Aarhus University / T. White.


The Seven Sisters, as they were known to the ancient Greeks, are now known to modern astronomers as the Pleiades star cluster – a set of stars which are visible to the naked eye and have been studied for thousands of years by cultures all over the world. Now Dr Tim White of the Stellar Astrophysics Centre at Aarhus University and his team of Danish and international astronomers have demonstrated a powerful new technique for observing stars such as these, which are ordinarily far too bright to look at with high performance telescopes. Their work is published in the Monthly Notices of the Royal Astronomical Society.

Using a new algorithm to enhance observations from the Kepler Space Telescope in its K2 Mission, the team has performed the most detailed study yet of the variability of these stars. Satellites such as Kepler are engineered to search for planets orbiting distant stars by looking for the dip in brightness as the planets pass in front, and also to do asteroseismology, studying the structure and evolution of stars as revealed by changes in their brightness.

Because the Kepler mission was designed to look at thousands of faint stars at a time, some of the brightest stars are actually too bright to observe. Aiming a beam of light from a bright star at a point on a camera detector will cause the central pixels of the star's image to be saturated, which causes a very significant loss of precision in the measurement of the total brightness of the star. This is the same process which causes a loss of dynamic range on ordinary digital cameras, which cannot see faint and bright detail in the same exposure.

"The solution to observing bright stars with Kepler turned out to be rather simple," said lead author Dr Tim White. "We're chiefly concerned about relative, rather than absolute, changes in brightness. We can just measure these changes from nearby unsaturated pixels, and ignore the saturated areas altogether."

But changes in the satellite's motion and slight imperfections in the detector can still hide the signal of stellar variability. To overcome this, the authors developed a new technique to weight the contribution of each pixel to find the right balance where instrumental effects are cancelled out, revealing the true stellar variability. This new method has been named halo photometry, a simple and fast algorithm the authors have released as free open-source software.

Most of the seven stars are revealed to be slowly-pulsating B stars, a class of variable star in which the star's brightness changes with day-long periods. The frequencies of these pulsations are key to exploring some of the poorly understood processes in the core of these stars.

The seventh star, Maia, is different: it varies with a regular period of 10 days. Previous studies have shown that Maia belongs to a class of stars with abnormal surface concentrations of some chemical elements such as manganese. To see if these things were related, a series of spectroscopic observations were taken with the Hertzsprung SONG Telescope.

"What we saw was that the brightness changes seen by Kepler go hand-in-hand with changes in the strength of manganese absorption in Maia's atmosphere," said Dr Victoria Antoci, a co-author of the work and Assistant Professor at the Stellar Astrophysics Centre, Aarhus University. "We conclude that the variations are caused by a large chemical spot on the surface of the star, which comes in and out of view as the star rotates with a ten day period."

"Sixty years ago, astronomers had thought they could see variability in Maia with periods of a few hours and suggested this was the first of a whole new class of variable stars they called 'Maia Variables'," White said, "but our new observations show that Maia is not itself a Maia Variable!"

No signs of exoplanetary transits were detected in this study, but the authors show that their new algorithm can attain the precision that will be needed for Kepler and future space telescopes such as the Transiting Exoplanet Survey Satellite (TESS) to detect planets transiting stars as bright as our neighboring star Alpha Centauri. These nearby bright stars are the best targets for future missions and facilities such as the James Webb Space Telescope, which is due to launch in late 2018.

Credit: ras.org.uk

The Crown of the Sun

The Crown of the Sun:

Discover the cosmos! Each day a different image or photograph of our fascinating universe is featured, along with a brief explanation written by a professional astronomer.

2017 August 23
See Explanation. Clicking on the picture will download the highest resolution version available.
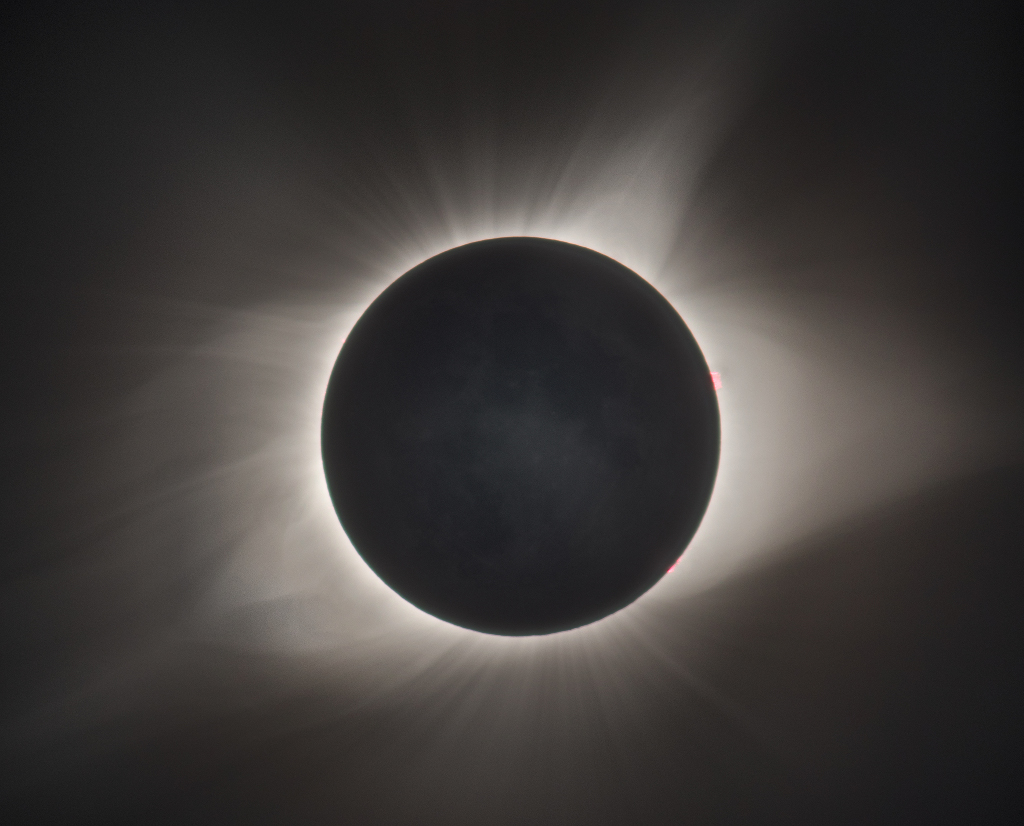
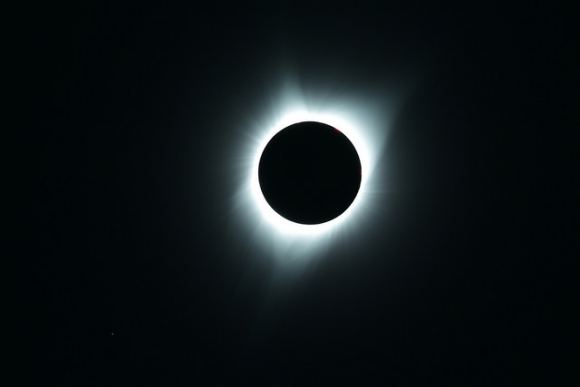
Explanation: During a total solar eclipse, the Sun's extensive outer atmosphere, or corona, is an inspirational sight. Streamers and shimmering features visible to the eye span a brightness range of over 10,000 to 1, making them notoriously difficult to capture in a single photograph. But this composite of telescopic images covers a wide range of exposure times to reveal the crown of the Sun in all its glory. The aligned and stacked digital frames were taken in clear skies above Stanley, Idaho in the Sawtooth Mountains during the Sun's total eclipse on August 21. A pinkish solar prominence extends just beyond the right edge of the solar disk. Even small details on the dark night side of the New Moon can be made out, illuminated by sunlight reflected from a Full Earth.

The Eagle and The Swan

The Eagle and The Swan:

Discover the cosmos! Each day a different image or photograph of our fascinating universe is featured, along with a brief explanation written by a professional astronomer.

2017 August 24
See Explanation. Clicking on the picture will download the highest resolution version available.

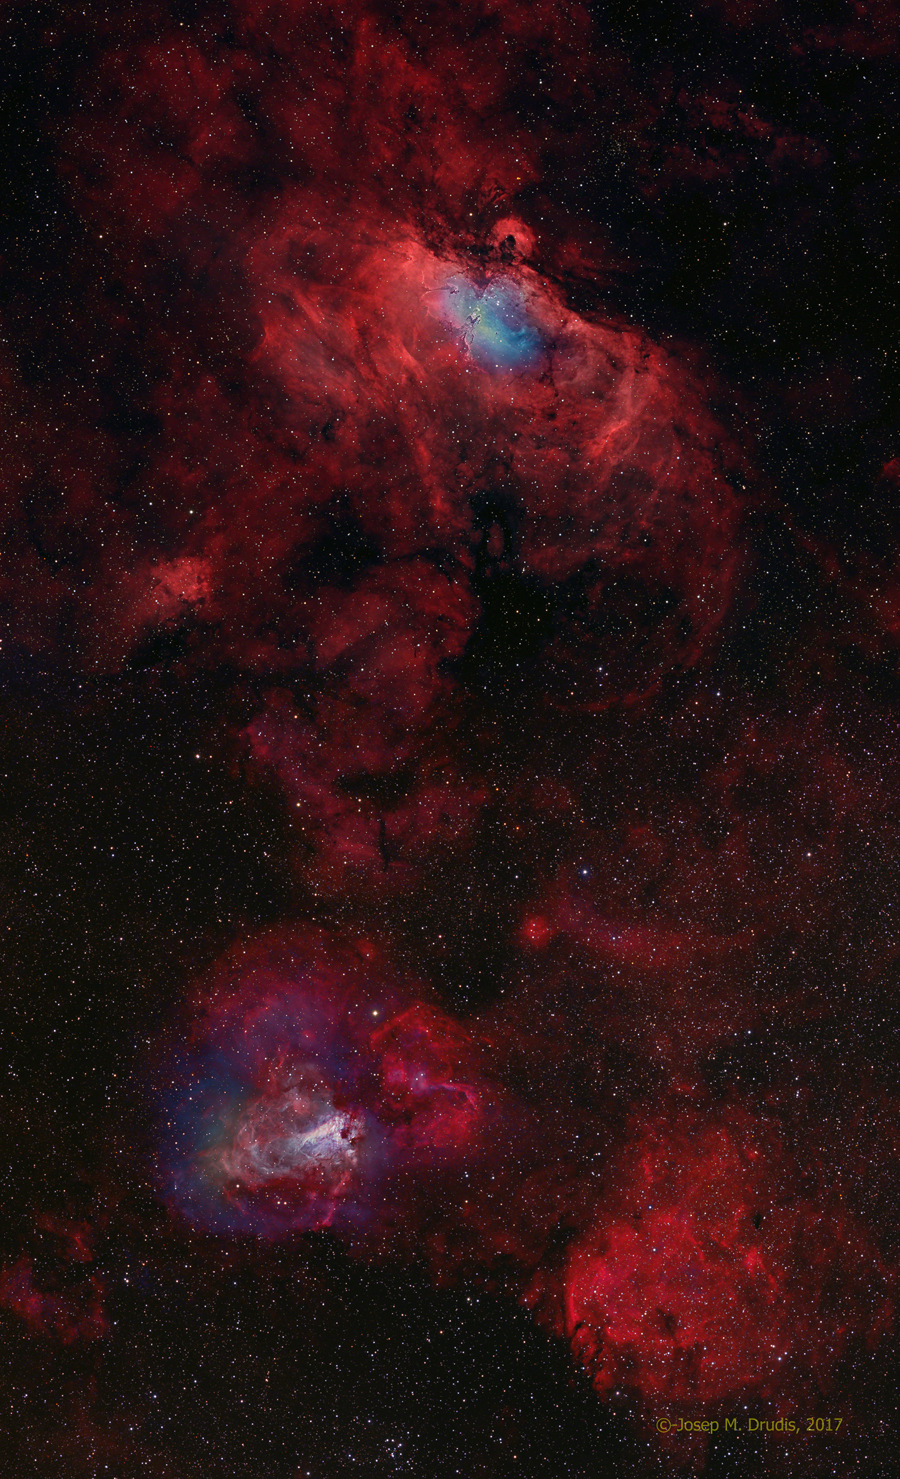
The Eagle and The Swan

Image Credit & Copyright: Josep Drudis


Explanation: The Eagle Nebula and the Swan Nebula span this broad starscape, a telescopic view toward the Sagittarius spiral arm and the center of our Milky Way galaxy. The Eagle, also known as M16, is at top and M17, the Swan, at bottom of the frame showing the cosmic clouds as brighter regions of active star-formation. They lie along the spiral arm suffused with reddish emission charactistic of atomic hydrogen gas, and dusty dark nebulae. M17, also called the Omega Nebula, is about 5500 light-years away, while M16 is some 6500 light-years distant. The center of both nebulae are locations of well-known close-up images of star formation from the Hubble Space Telescope. In this mosaic image that extends about 3 degrees across the sky, narrowband, high-resultion image data has been used to enhance the central regions of the Eagle and Swan. The extended wings of the Eagle Nebula spread almost 120 light-years. The Swan is over 30 light-years across.

Tomorrow's picture: pixels in space


< | Archive | Submissions | Index | Search | Calendar | RSS | Education | About APOD | Discuss | >


Authors & editors: Robert Nemiroff (MTU) & Jerry Bonnell (UMCP)
NASA Official: Phillip Newman Specific rights apply.
NASA Web Privacy Policy and Important Notices
A service of: ASD at NASA / GSFC
& Michigan Tech. U.

Diamond Ring in a Cloudy Sky

Diamond Ring in a Cloudy Sky:

Discover the cosmos! Each day a different image or photograph of our fascinating universe is featured, along with a brief explanation written by a professional astronomer.

2017 August 25
See Explanation. Clicking on the picture will download the highest resolution version available.
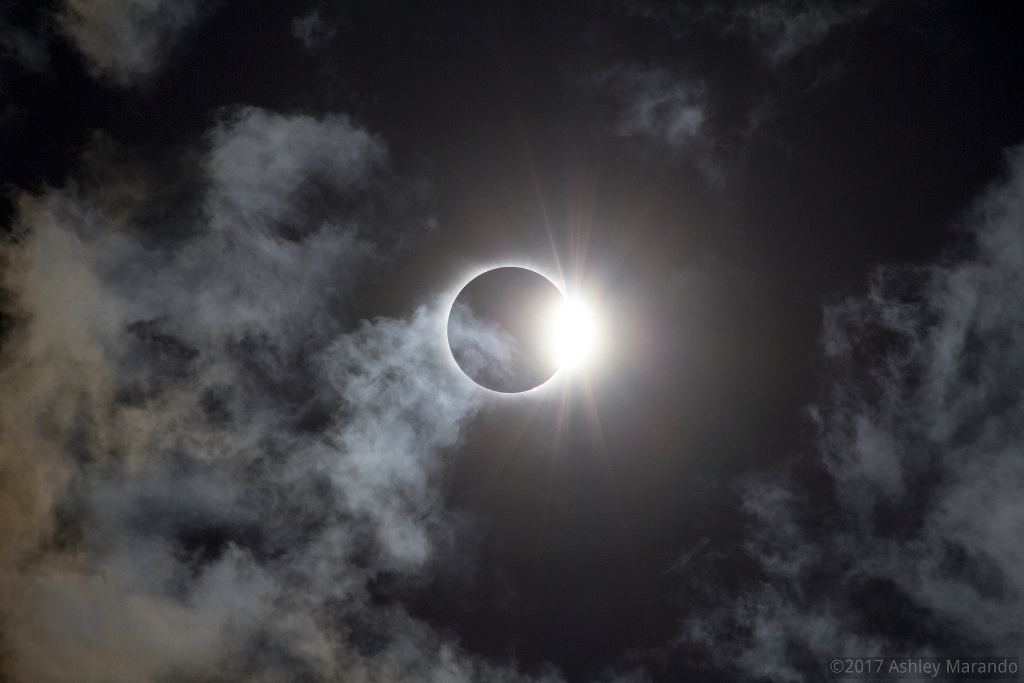
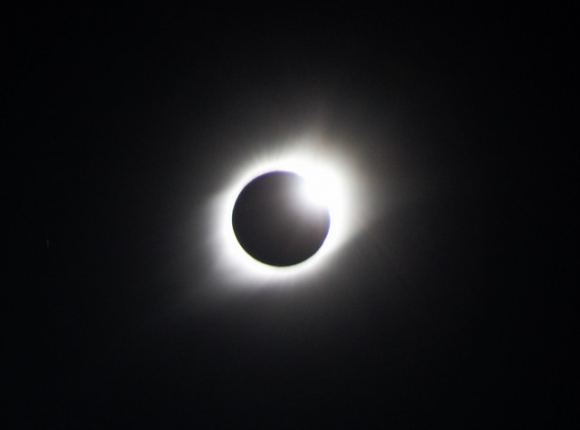
Explanation: As the Moon's shadow swept across the US on August 21, eclipse chasers in the narrow path of totality were treated to a diamond ring in the sky. At the beginning and end of totality, the fleeting and beautiful effect often produces audible gasps from an amazed audience. It occurs just before or after the appearance of the faint solar corona with a brief ring of light and glimpse of Sun. In this scene from the end of totality at Central, South Carolina, clouds drift near the Sun's diamond ring in the sky.

Saturn-lit Tethys

Saturn-lit Tethys: Cassini gazes across the icy rings of Saturn toward the icy moon Tethys, whose night side is illuminated by Saturnshine, or sunlight reflected by the planet.


Original enclosures:


The Eclipse 2017 Umbra Viewed from Space

The Eclipse 2017 Umbra Viewed from Space: As millions of people across the United States experienced a total eclipse as the umbra, or moon’s shadow passed over them, only six people witnessed the umbra from space. The space station crossed the path of the eclipse three times as it orbited above the continental United States at an altitude of 250 miles.


Original enclosures:


Incredible Solar Eclipse Images From Our Readers

Incredible Solar Eclipse Images From Our Readers:


Holy moly, that was awesome! Incredible, fantastic, amazing…there just aren’t the words to describe what it is like to experience totality. While I’m trying to come down to Earth and figure out how to explain how wonderful this was, enjoy the beautiful images captured by our readers from across the US and those from across the world who traveled to capture one of nature’s most spectacular events: a total solar eclipse.

The images from those seeing partial eclipses are wonderful, as well, and we’ll keep adding them as they come in (update, we just got some from Europe too). Great job everyone!


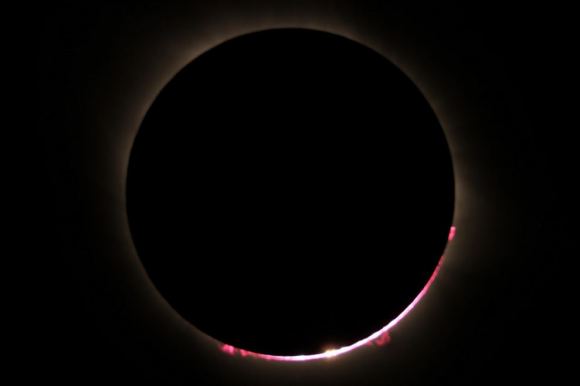
Eclipse panorama. Got some cool Baily’s Beads and that prominence is nuts! Shot at 2000mm on an old Celestron 8in telescope! Credit and copyright: Kenneth Brandon.


2017 Solar Eclipse from Clayton GA, USA.
Celestron C8 Telescope on CGEM. Canon T3i (Modified IR enhanced), Solar Filter. Credit and copyright: Michael Bee.


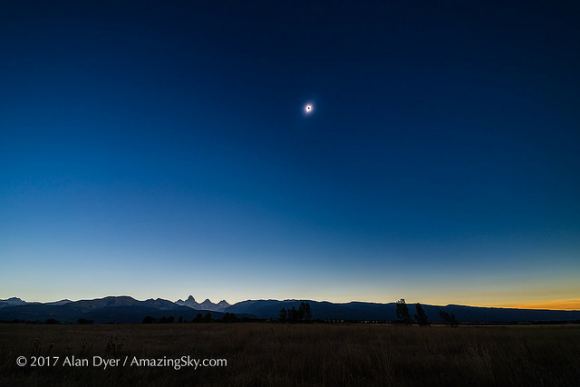
The August 21, 2017 total solar eclipse over the Grand Tetons as seen from the Teton Valley in Idaho, near Driggs. ..This is from a 700-frame time-lapse and is of second contact just as the diamond ring is ending and the dark shadow of the Moon is approaching from the west at right, darkening the sky at right, and beginning to touch the Sun. The peaks of the Tetons are not yet in the umbral shadow and are still lit by the partially eclipsed Sun. ..With the Canon 6D and 14mm SP Rokinon lens at f/2.5 for 1/10 second at ISO 100. Credit and copyright: Alan Dyer.


Total Solar Eclipse, August 21, 2017 as seen from Tellico Plains, Tennessee. New City Expedition, photo by Igor Kuskovsky.


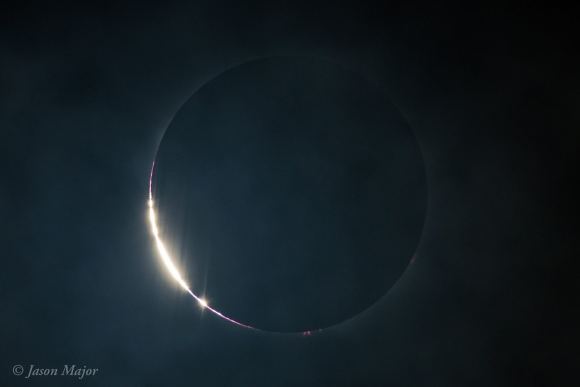
Total Solar Eclipse, Aug. 21, 2017, as seen from Charleston, South Carolina. Credit and copyright: Jason Major


Partial Eclipse montage from Charlottesville, Virginia. Credit and copyright: David Murr.


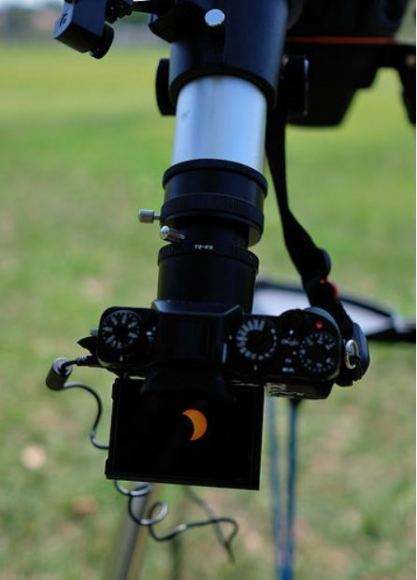
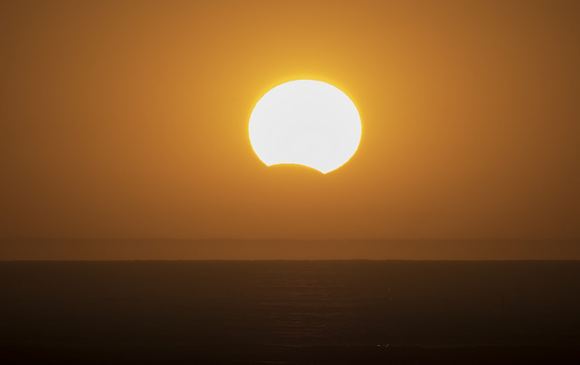
Partial Solar Eclipse August 21st 2017, as seen from Fullerton California USA. Sky: Partially Cloudy. Telescope: Nexstar 102 SLT Refractor, Camera: Fujifilm X-T1 @ Prime Focus. Credit and copyright: Jimmy CD.


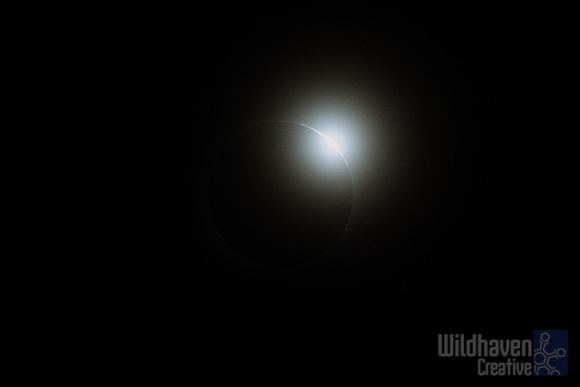
From the total solar eclipse as seen in Columbia, Missouri, on Aug. 21, 2017. Credit and copyright: Wildhaven Creative.


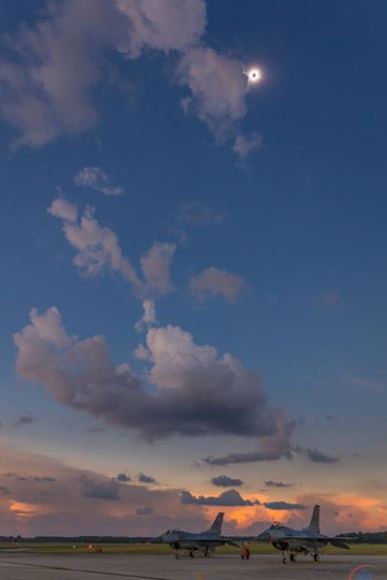
Total Eclipse from Shaw Air Force Base (August 21, 2017). It was magical. Credit and copyright: Michael Seeley.
— FelipeSg (@SanFelipeSG) August 21, 2017
— Mike Cohea (@MikeCohea) August 21, 2017
Short video I took from McMinnville, TN. Can you see it!!! ?? #Eclipse2017 pic.twitter.com/zVNXvLOLSI
— Holly ? (@absolutspacegrl) August 21, 2017
— Zaid Benjamin (@zaidbenjamin) August 21, 2017


Partial solar eclipse, seen from the west coast of France, August 21, 2017. Credit and copyright: Frank Tyrlik.
Aerial panorama of the total solar eclipse over Kansas. Two minutes earlier it was still raining. #eclipse #eclipse2017 @DJIGlobal pic.twitter.com/1zSIsKlZ8E
— Romeo Durscher (@romeoch) August 21, 2017


Great American Eclipse, 21-08-2017. Silver Falls Oregon 10:17-10:19 local time. Raw straight out of the camera. 65mm Refractor / Canon 700D. Credit and copyright: Alexandra Hart.
Still sorting through the 850+ photos I shot today, a rough edit #Eclipse2017 pic.twitter.com/r4SC4YABtD
— Tony Rice (@rtphokie) August 21, 2017
The post Incredible Solar Eclipse Images From Our Readers appeared first on Universe Today.