Photos of Nature, Nature Photography Across The Universe. All about Nature, Love, Travel, Beautiful Photo, Landscape, Sunset, Summer, Mountains, Flowers, Photographer, Wallpaper, Portrait, Photo, what is the Universe
Photos of Nature | Nature Photography What is The Universe
Brace yourselves. You are about to hear talk this week of an astronomical non-occurrence of the utmost in obscurity. We're talking about this weekend's Blue Moon.
Now, I know what you're thinking. Isn't a 'Blue Moon' the second Full Moon of the month? How can a Blue Moon fall on the 21st? Trust me, we're both correct... in a sense. The term 'Blue Moon' has taken on several meanings over the last few decades, with the 'the second Full Moon in a calendar month containing two Full Moons' now in vogue across ye old Internet. It seems the masses just can't get enough of Super, Blood, Honey and Moons Black and Blue. We point to last month's rumored 'Green Moon' as evidence. (Spoiler alert: it wasn't).
No, we're talking instead of a Blue Moon in an old-timey sense. You'll be hard pressed to explain source of this week's Blue Moon for sure, though it has a fascinating origin story.
The term seems to come down to us from the Maine Farmer's Almanac, which denoted the 'third Full Moon in an astronomical season with four as blue.' The lunar synodic period of 29.5 days — the length of time it takes the Moon to return to a like phase, such as New to New, or Full to Full — means that on most years, there are 12 Full Moons. 29.5 times 12 comes out about 11 days short of a 365.25 day solar year at 354 days, meaning that about every three years, we have a year with 13 Full Moons.
Not a big deal, you say? Well, it assures that lunar based forms of reckoning time, such as the Muslim calendar loses 11 days relative to the Gregorian calendar every year.
March Equinox- March 20th 4:30 Universal Time (UT)
March Full Moon- March 23rd 12:02 UT
April Full Moon- April 22nd 5:22 UT
May Full Moon- May 21st 21:17 UT (3rd in an astronomical season, 'blue')
June Full Moon- June 20th 11:05 UT
June Solstice- June 20th 22:34 UT
The last time we had a season with four Full Moons was August 21st, 2013, and the next Blue Moon under this rule is May 18th, 2019.
Of course, a deeper riddle is just why the Maine Farmer's Almanac termed this occurrence as Blue, and why they picked the 3rd of a season with 4 specifically... one legend goes that the extra anomalous Full Moon was depicted on the calendar in blue ink to stand out. We'd love to get our hands on a copy of the Old Maine Farmer's Almanac circa late 19th early 20th century era to see if this was indeed the case. This is on our list of research projects, next time we find ourselves back in our home state of Maine.
We've chronicled the tales of Moons, both Black and Blue. Sky and Telescope also explored the role they had in introducing the modern day Blue Moon into common vernacular. We'll admit, the '2nd in a month with two Full Moons' is a much easier rule to explain!
Of course, the Moon isn't scheduled to actually appear blue this week... that's actually a much rarer occurrence, and the Moon doesn't need to even be Full for this to happen. In September 23rd, 1950, the residents of the northeastern United States saw the 94% illuminated waxing gibbous Moon rise with a distinctly bluish cast, owing to the high concentration of oily soot particles suspended high in the atmosphere, scattering out red and yellow light but filtering through blue. Reports of similar Blue Moons dot observational lore, though to our knowledge, no one has actually captured an image of such a cerulean apparition of the Moon.
Is the Moon ever really Full? You can make a pretty good argument that the Moon as seen from the Earth is never truly fully illuminated, though it gets really close. Full 100% illumination would occur when the Moon is exactly opposite to the Sun, but when this occurs, the Moon also passes into the dark shadow of the Earth, during a total lunar eclipse.
Fun fact: the next 'Blue Blood Moon' lunar eclipse occurs on January 31st, 2018, following the '2nd Full Moon in a month with 2' rule.
The May Full Moon also has the romantic name of the Full Flower, Corn Planting or Milk Moon in Algonquin Indian lore.
In 2016, the Moon continues to follow a shallow path relative to the ecliptic plane, which in turn traces out the Earth's path around the Sun. 2015 was the bottoming out of the 'shallow year' known as a minor lunar standstill, and we're now headed towards a hilly or steep year of a major lunar standstill in 2025, a time once every 19 years when the Moon rides high in the sky, adding its 5 degree inclination relative to the ecliptic plane.
Will this weekend's olden times Blue Moon gain traction in today's fast-paced social media news cycle? Stay tuned!
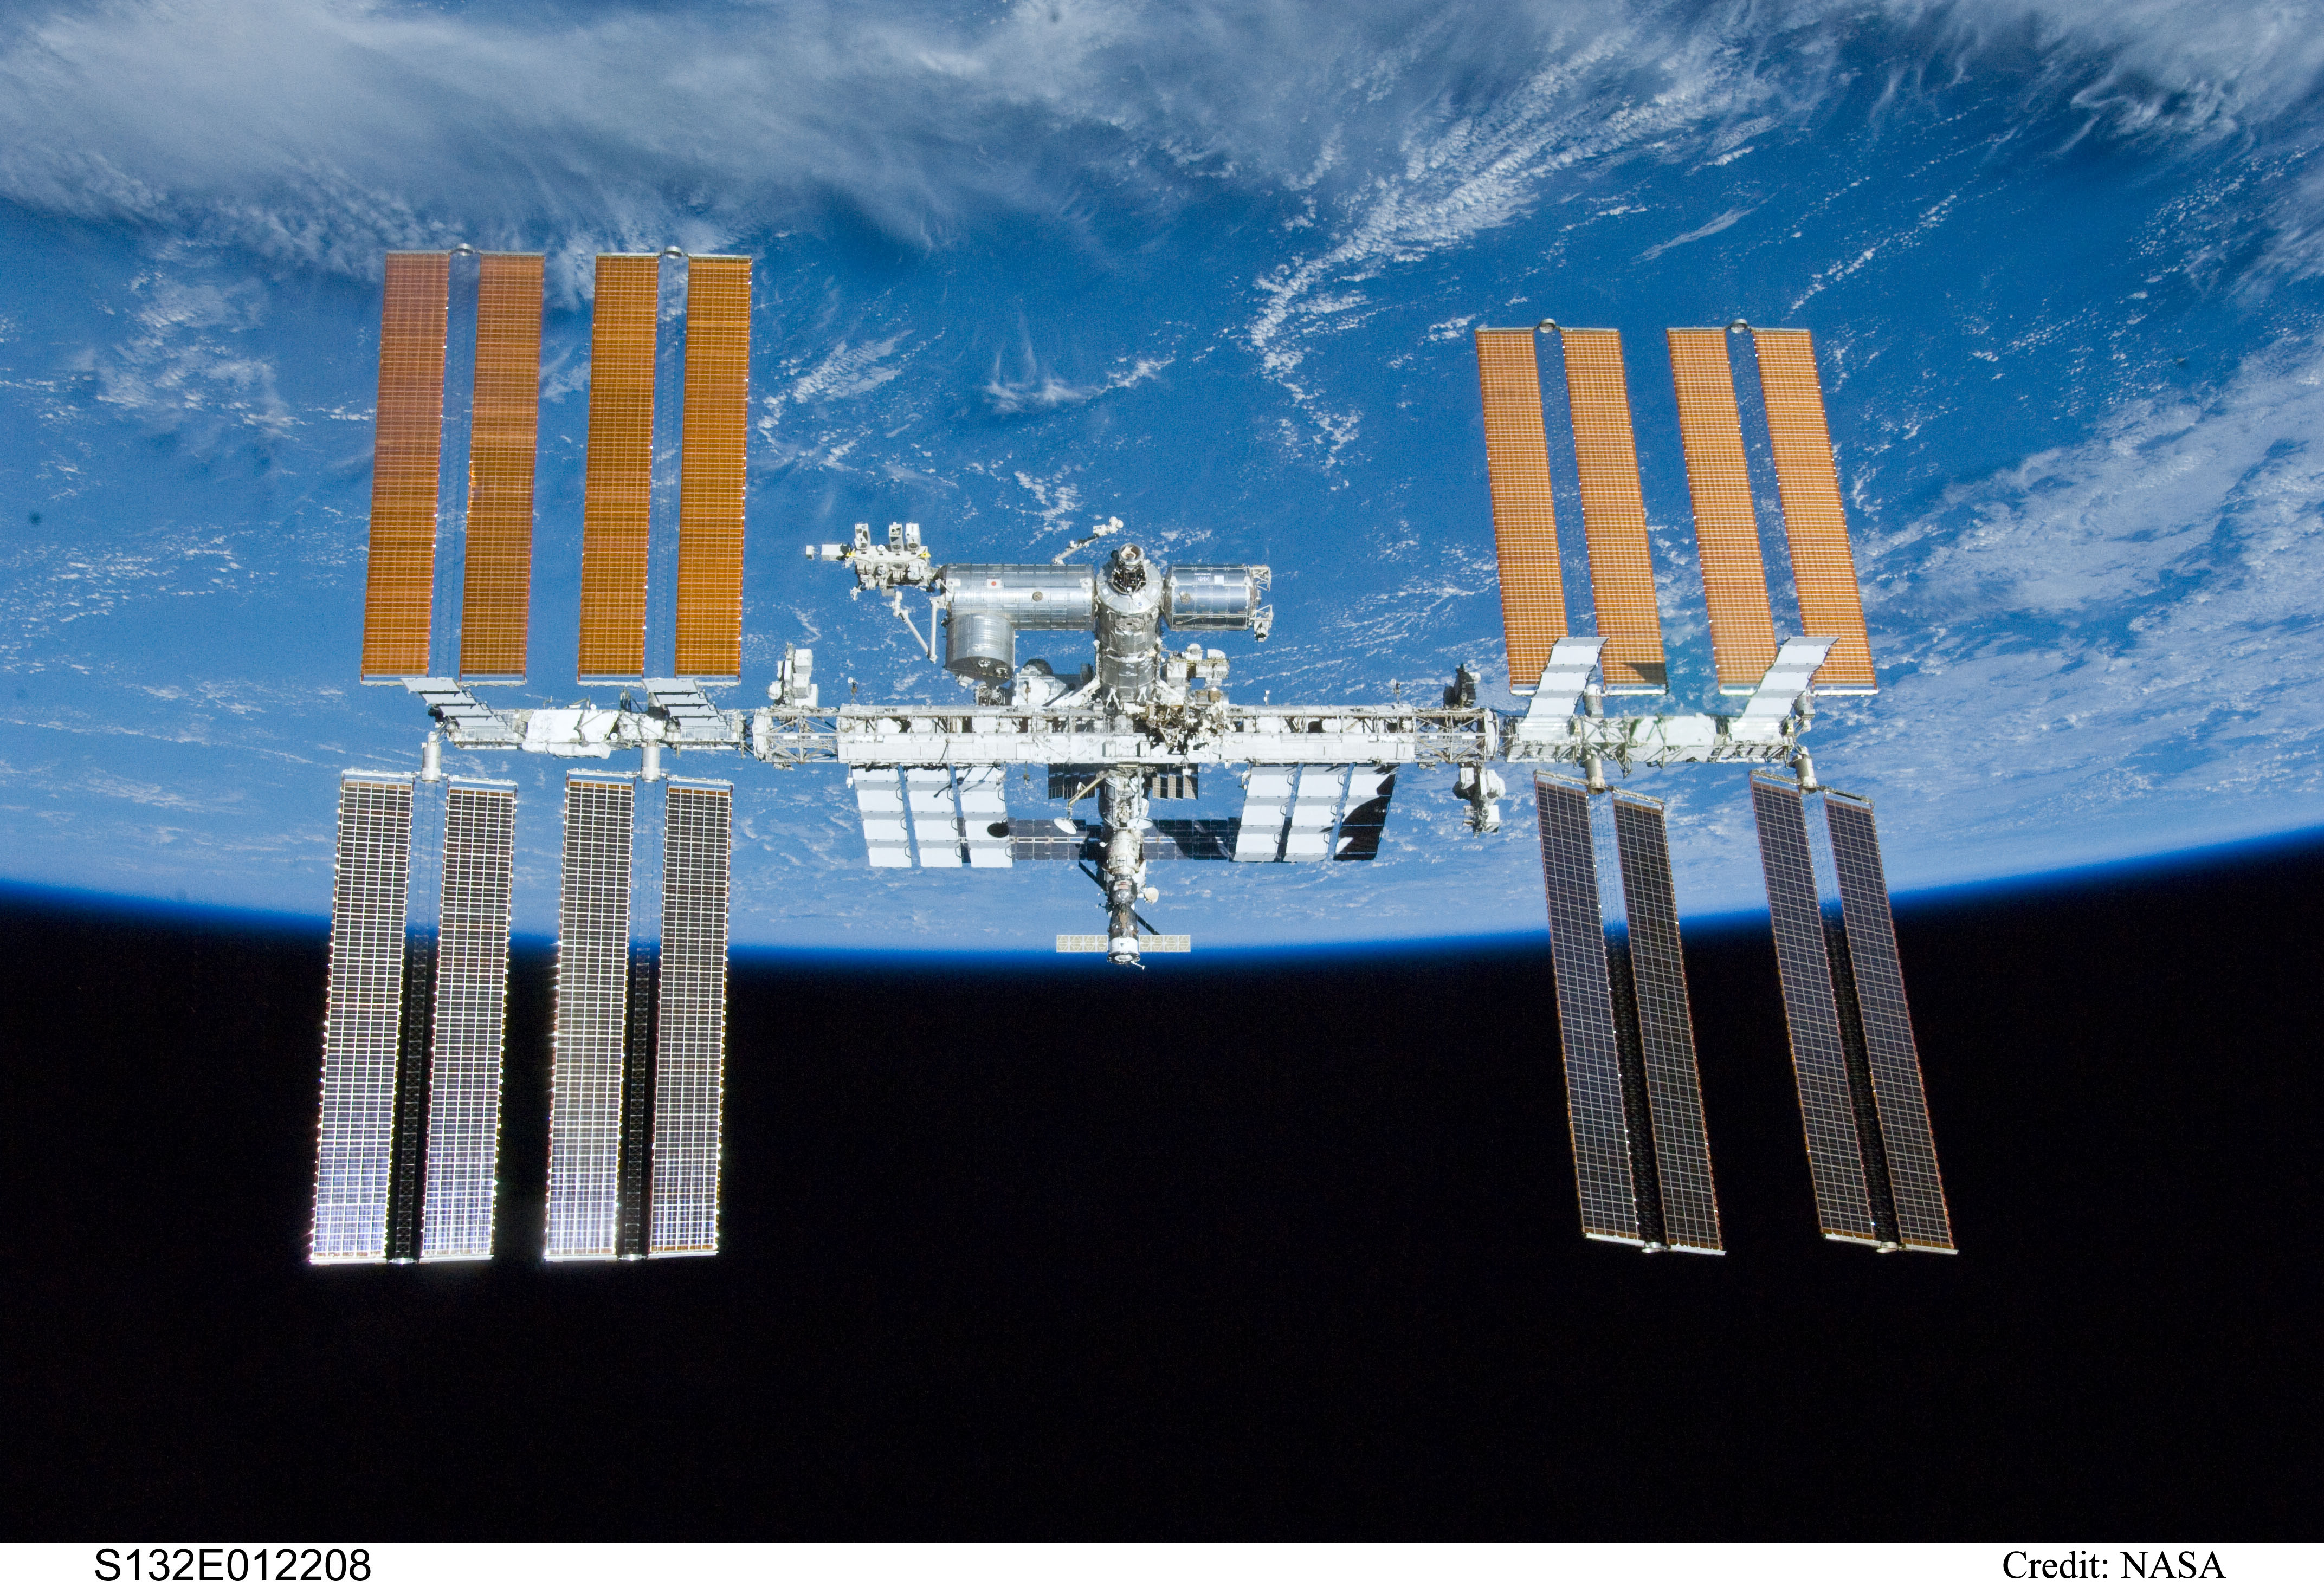
It is known as the Cupola, an observation and work area that was installed aboard the International Space Station in 2010. In addition to giving the crew ample visibility to support the control of the Station's robotic arms, it is also the best seat in the house when it comes to viewing Earth, celestial objects and visiting vehicles. Little wonder then why sp many breathtaking pictures have been taken from inside it over the years.
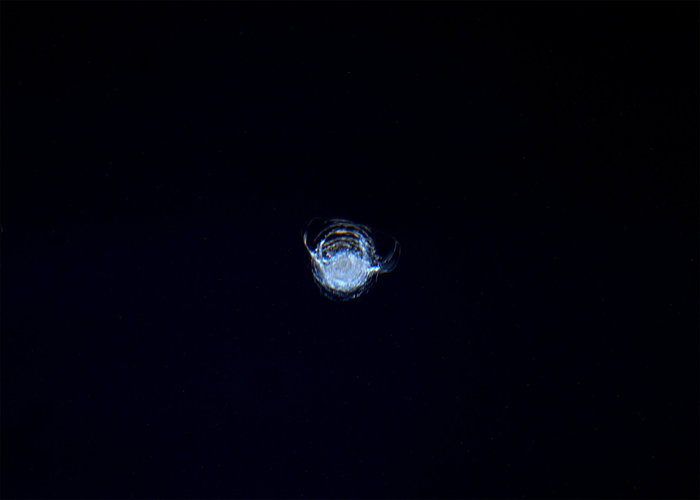
So you can imagine how frustrating it must be for the crew when a tiny artificial object (aka. space debris) collides with the Cupola's windows and causes it to chip. And thanks to astronaut Tim Peake and a recent photo he chose to share with the world, people here on Earth are able to see just how this looks from the receiving end for the first time.
The picture was snapped last month, and shows a chip in the Cupola window that measures 7 mm in diameter. The crew speculate that it was most likely caused by the impact of a tiny piece of space debris, possibly a paint flake or small metal fragment. Though it would have been no bigger than a few thousandths of a millimeter across, the orbital velocity of debris and the ISS meant that when they struck, the impact was hard enough to leave a mark!
According to Peake, the picture was motivated in part by a question which - as an astronaut - he is routinely asked. “I am often asked if the International Space Station is hit by space debris," he said. "Yes – this is the chip in one of our Cupola windows, glad it is quadruple glazed!”
In other words, there was no threat of decompression from this chip in the window. Still, I'm betting that it's times like these that the ISS wishes there was such a thing as orbital window insurance! And while the chip shown in the pictures was minor in nature, larger debris can pose a serious threat to orbiting labs and spaceships.
An object up to 1 cm in size - which by definition falls into the category of a meteoroid - could disable an instrument or a critical flight system aboard the ISS or anything else in orbit of Earth. Something larger than 1 cm could penetrate the shields on the Station's crew modules, leading to dangerous decompression. And anything larger than 10 cm, could literally destroy the ISS.
And given it position in Low Earth Orbit (LEO), the threat of space debris, which comes in all forms - spent rocket stages, satellites that are no longer in use, paint flakes, metal fragments, and natural meteoroids and micrometeoroids - are a significant threat. In fact, it was estimated in 2013 that more than 500,000 pieces of debris - which travel at speeds up to 28,164 km/h (17,500 mph) - were being tracked as they orbited the Earth.
However, NASA, the ESA, Roscosmos and other space agencies routinely monitor Earth's orbit to determine if there's any potential for collisions between the ISS and large pieces of space junk. The station itself is also protected by layers of shielding designed to withstand collisions with smaller ones, so there is little chance the station and its crews are ever threatened.
The larger objects in LEO are less of a threat because their orbits can be predicted, and these are tracked remotely from the ground. This allows the crews to conduct Debris Avoidance Maneuvers (DAMs), which uses thrusters on the Russian Orbital Segment to alter the station's orbital altitude. The ISS performed eight DAMs between Oct 1999 and March 2009, and another two between late March and mid-July of 2009.
In the event where a potential threat was identified too late to conduct a DAM, the crews close all the hatches aboard the station and retreat into their Soyuz spacecraft (or whichever module is currently docked) so they may evacuate if a serious collision occurs. Such partial evacuations have been conducted four times in the station's history, between March 2009 and June 2015.
As for objects that are too small to track, the station relies on shielding, which is divided between the Russian Orbital Segment (ROS) and the US Orbital Segment (USOS). The USOS is protected by a thin aluminum sheet space from the hull. This shield causes objects to shatter into a cloud before hitting the hull, thereby spreading the energy of the impact.
The ROS, meanwhile, is protected by a carbon plastic honeycomb screen, an aluminum honeycomb and a glass cloth cover, all of which are separated from the hull by a screen-vacuum thermal insulation covering. The ROS' shielding is about 50% less likely to be punctured, which is why the crew move to the ROS whenever the station is under threat. The ISS also relies on ballistic panels (aka. "micrometeorite shielding) to protect pressurized sections and critical systems.
And of course, the ESA chose to take this occasion to remind everyone that with this and other impacts, they are on top of things. As Holger Krag, Head of ESA’s Space Debris Office said in a recent statement:
"[The] ESA is at the forefront of developing and implementing debris-mitigation guidelines, because the best way to avoid problems from orbital debris is not to cause them in the first place. These guidelines are applied to all new missions flown by ESA, and include dumping fuel tanks and discharging batteries at the end of a mission, to avoid explosions, and ensuring that satellites reenter the atmosphere and safely burn up within 25 years of the end of their working lives.”
The Cupola is also where ESA's Nightpod camera aid is installed to help astronauts take sharper pictures at night. Over the years, this has allowed for some of the most breathtaking photos of Earth from orbit to be snapped. You can check some of them out at the Space in Images section of the ESA's website. And in the meantime, it not be too soon to start contemplating insurance for orbital habitats!
Discover the cosmos! Each day a different image or photograph of our fascinating universe is featured, along with a brief explanation written by a professional astronomer.
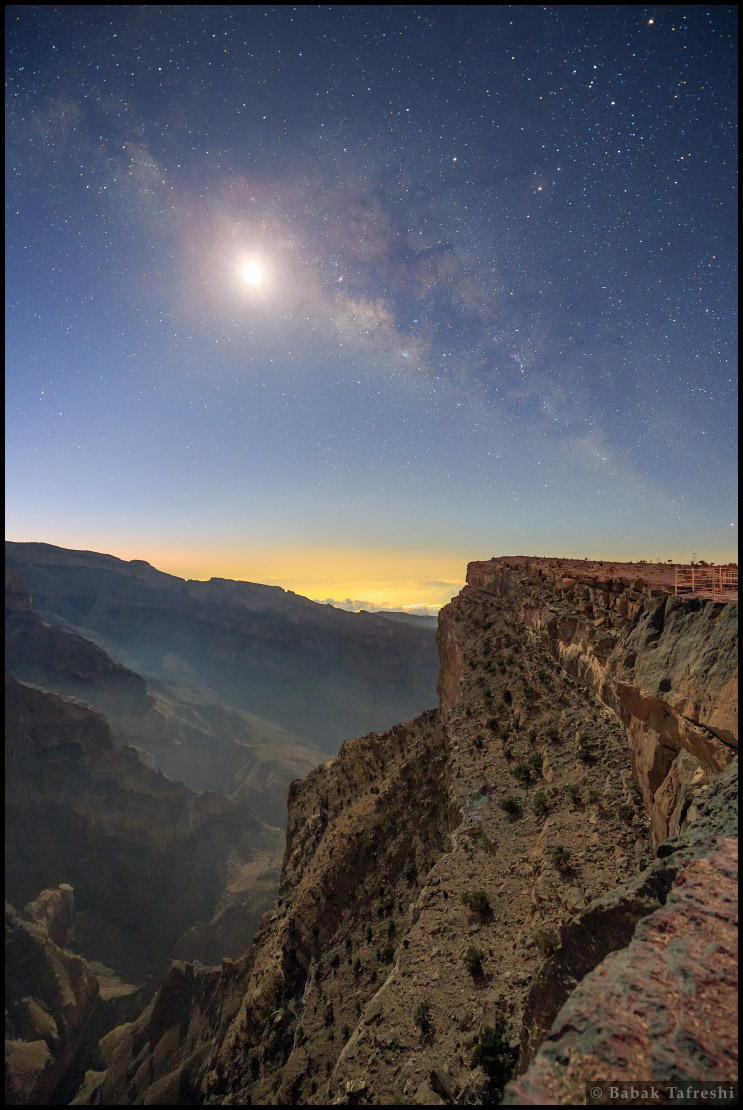
Explanation: A waning crescent moon, early morning twilight, and Al Hamra's city lights on the horizon can't hide the central Milky Way in this skyscape from planet Earth. Captured in a single exposure, the dreamlike scene looks southward across the region's grand canyon from Jabal Shams (Sun Mountain), near the highest peak in Oman, on the Arabian Peninsula. Mist, moonlight, and shadows still play along the steep canyon walls. Dark rifts along the luminous band of the Milky Way are the galaxy's cosmic dust clouds. Typically hundreds of light-years distant, they obscure starlight along the galactic plane, viewed edge-on from the Solar System's perspective.
Discover the cosmos! Each day a different image or photograph of our fascinating universe is featured, along with a brief explanation written by a professional astronomer.
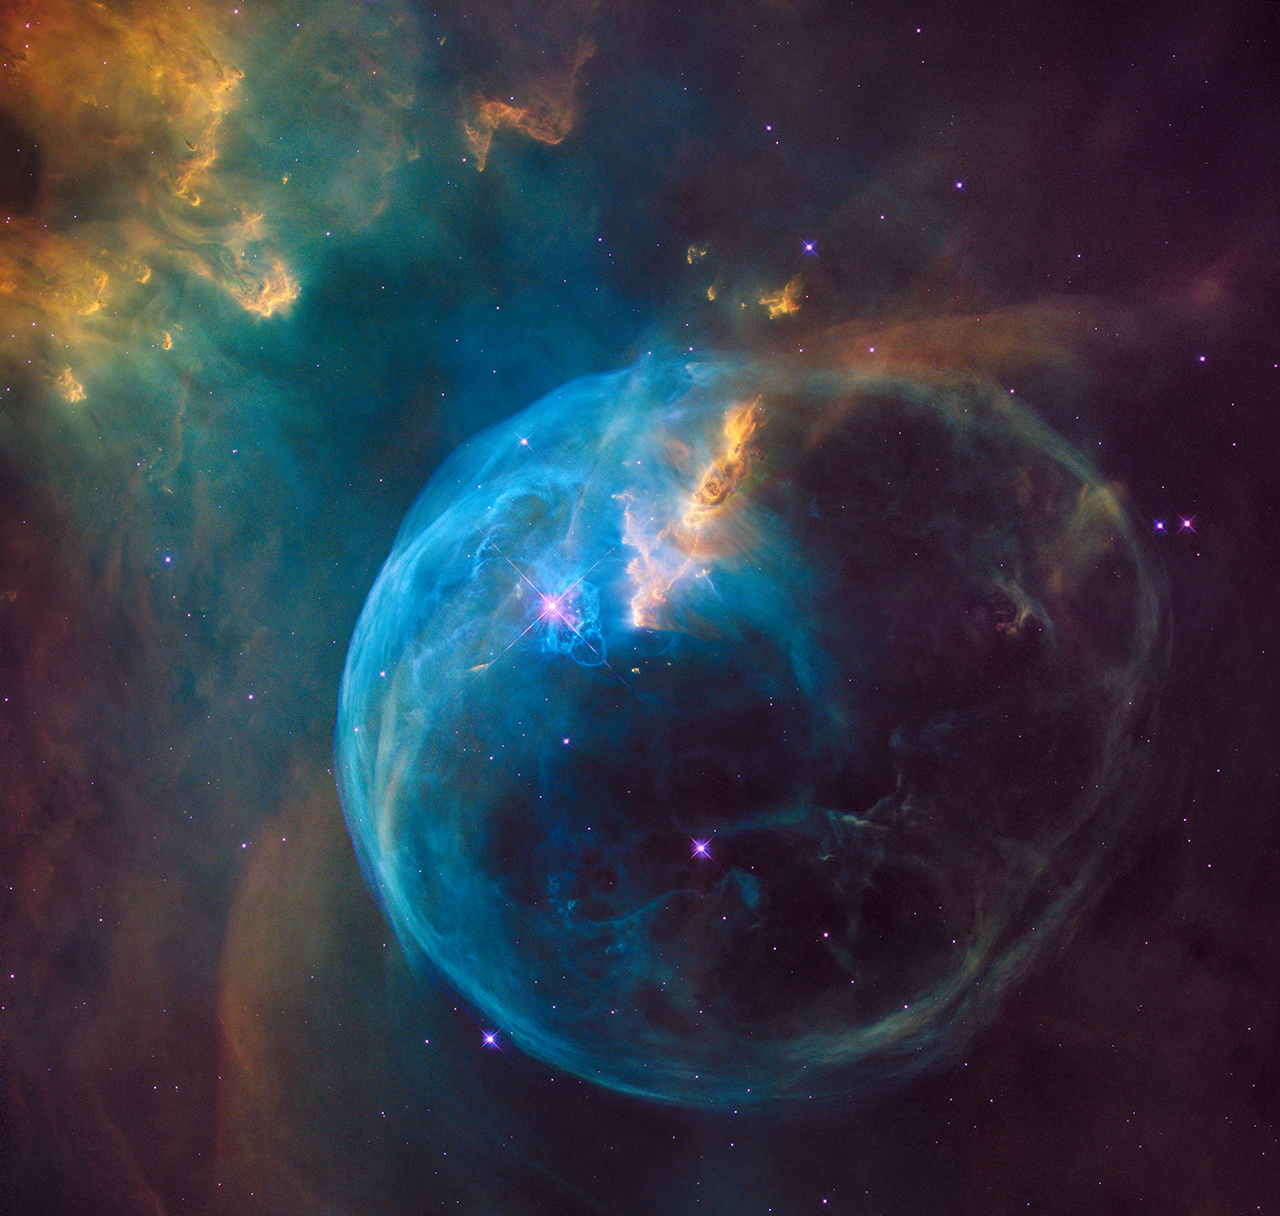
Explanation: Blown by the wind from a massive star, this interstellar apparition has a surprisingly familiar shape. Cataloged as NGC 7635, it is also known simply as The Bubble Nebula. Although it looks delicate, the 7 light-year diameter bubble offers evidence of violent processes at work. Above and left of the Bubble's center is a hot, O-type star, several hundred thousand times more luminous and around 45 times more massive than the Sun. A fierce stellar wind and intense radiation from that star has blasted out the structure of glowing gas against denser material in a surroundingmolecular cloud. The intriguing Bubble Nebula and associated cloud complex lie a mere 7,100 light-years away toward the boastful constellation Cassiopeia. This sharp, tantalizing view of the cosmic bubble is a composite of Hubble Space Telescope image data from 2016, released to celebrate the 26th anniversary of Hubble's launch.
On June 30th, 1905, Albert Einstein started a revolution with the publication of theory of Special Relativity. This theory, among other things, stated that the speed of light in a vacuum is the same for all observers, regardless of the source. In 1915, he followed this up with the publication of his theory of General Relativity, which asserted that gravity has a warping effect on space-time. For over a century, these theories have been an essential tool in astrophysics, explaining the behavior of the Universe on the large scale.
However, since the 1990s, astronomers have been aware of the fact that the Universe is expanding at an accelerated rate. In an effort to explain the mechanics behind this, suggestions have ranged from the possible existence of an invisible energy (i.e. Dark Energy) to the possibility that Einstein's field equations of General Relativity could be breaking down. But thanks to the recent work of an international research team, it is now known that Einstein had it right all along.
Using the Fiber Multi-Object Spectrograph (FMOS) on the Subaru Telescope, the team - which was led by researchers from Japan's Institute for the Physics and Mathematics of the Universe (Kavli IMPU) and the University of Tokyo - created the deepest 3-D map of the Universe to date. All told, this map contains some 3,000 galaxies and encompasses a volume of space measuring 13 billion light-years.
To test Einstein’s theory, the team - which was led by Dr. Teppei Okumura, a Kavli IPMU Project Researcher - used information obtained by the FastSound Project over the past few years. As part of their effort to ascertain the origins of cosmic acceleration, this project relies on data collected by the Subaru telescope to create a survey that monitors the redshift of galaxies.
From what was observed over the course of 40 nights (between 2012 and 2014), the FastSound Survey was able to determine the on velocities and clustering of more than 3,000 distant galaxies. Measuring their redshift space distortions to see how fast they were moving, Okumura and his team were able to track the expansion of these galaxies out to a distance of 13 billion light-years.
This was an historic feat, seeing as how previous 3-D models of the Universe have not been able to reach beyond 10 billion light years. But thanks to the FMOS on the Subaru Telescope, which can analyze galaxies 12.4 to 14.7 billion light-years away, the team was able to break this record. They then compared the results to the kind of expansion predicted by Einstein's theory, particularly the inclusion of his cosmological constant.
Originally introduced by Einstein in 1917 as an addition to his theory of General Relativity, the cosmological constant was basically a way to hold back gravity and achieve a static Universe. And while Einstein abandoned this theory when Edwin Hubble discovered that the Universe was expanding, it has since come to be an accepted part of the standard model of modern cosmology (known as the Lambda-CDM model).
https://youtu.be/RAiPZ_oUPI4
What the research team found was that even at a distance of 13 billion light-years into the Universe, the rules of General Relativity are still valid. “We tested the theory of general relativity further than anyone else ever has," said Dr. Okumura. "It’s a privilege to be able to publish our results 100 years after Einstein proposed his theory.”
These results have helped resolve something that astronomers have been puzzling over for decades, which was whether or not Einstein's cosmological constant could be shown to be consistent with an expanding Universe. And while various experiments have confirmed that General Relativity did match observational data, they have been somewhat limited in the past.
For example, the Pound-Rebka experiment, which took place in 1960, was the first confirmation of Einstein's theory. However, this experiment, and the many that followed in the ensuing decades, were either indirect or confined to the Solar System. A 2010 experiment conducted by researchers from Princeton University confirmed General Relativity to a distance of 7 billion light years.
But with this experiment, General Relativity has been confirmed to a distance of 13 billion light years, which accounts for the vast majority of the Universe that we can see (which is 13.8 billion light-years). It seems that even a century later, Einstein's theories are still holding up. And considering that he once claimed that the cosmological constant was the "biggest blunder" of his scientific career!
“If I can’t make it through one door, I’ll go through another door – or I’ll make a door. Something terrific will come no matter how dark the present.” -Rabindranath Tagore
Time continues marching on here at Starts With A Bang, just as it does everywhere. My Patreon supporters have stepped up their game, and we’re just $21 shy of unlocking our next goal! There are two great new items this week I’d love to share with you: first, our newest Podcast on dark energy and the fate of the Universe,
and second, a video whose script I helped write (with a bonus coming up) for Kurzgesagt – In a Nutshell, who make some of the best science videos I’ve ever seen:
We’ve also produced a fine suite of articles this week, and here’s a look back at them all:
For those of you in Washington State, head on over to Centralia College on May 20th at noon, where I’ll be speaking on Fate of the Universe. (And autographing books, too!) Now let’s jump on in to the best of the second week in May, and dive into our Comments Of The Week!
Image credit: NCEP CFSR 1981-2010 Climatology / Ryan N. Maue / WeatherBELL.
From Apeon LastnmUnk on the concept of settled science: “Your description of science as continually seeking, and never being absolute, refutes the “Settled Science” of Global Warming.”
By that logic, the attributes of continually seeking and never being absolute would refute any scientific conclusions one would ever make. See if you can follow this train:
Science accumulates large amounts of data through experiment, measurement and observation: a suite of evidence.
In that suite of evidence are uncertainties: uncertainties in the measurements/observations themselves and uncertainties about what results other experiments-not-performed and observations-not-made would yield.
And then, to explain it all, we have scientific theories that are valid over a certain range, with a certain degree of confidence we can express.
The Global Warming theory — that the Earth is warming and that human-caused changes to the atmosphere is the culprit — has been quantified to be valid at approximately 4.8-sigma statistical significance: to a 99.999%+ probability. Yes, there are more things to understand about it, but my description is not a refutation, unless you’re being completely dishonest about what science is and isn’t.
Image credit: Rutgers, retrieved from http://www.physics.rutgers.edu/~zrwan/physics/.
From Sinisa Lazarek on the Stern-Gerlach experiments: “Concerning entanglement: “So what if you took the ones you measured to be +ħ/2 in the x-direction, then measured the y-direction …. ”
Because you simply CAN’T do that in real life. Once you made ONE measurement, that’s it… game over. No more entangled pair.
You can entangle them again, but this is a completely new [measurement], absolutely unconnected to the one you did before, in all practical sense.. they are new particle pairs.”
I think there has been a misunderstanding here. The Stern-Gerlach experiment isn’t about entanglement, it’s about quantum indeterminism and the nature of quantum systems. If you have a spin-ħ/2 particle, it will have a spin along the x-axis that’s either +ħ/2 or -ħ/2, right? Same with the y-axis and the z-axis. It’s all in an indeterminate state, until you measure it.
Yet if you measure the spin in the x-direction and get, say, +ħ/2, you destroy all the information about the y-axis and z-axis directions. They now have 50/50 shots of being +ħ/2 and -ħ/2. If you then measure the y-axis spin and get -ħ/2, the x-direction is now re-randomized, and has a 50/50 shot of being +ħ/2 and -ħ/2. That’s the point of Stern-Gerlach; nothing to do with entanglement.
From See Noevo on flippancy: “Welcome to the SciFi Channel.”
Here’s a quote for you that I think applies: “Don’t waste your time trying to explain yourself to people that are committed to misunderstanding you.” You clearly have all the answers you want or need, so there’s no need for me to provide anything further to you, right?
The giant elliptical galaxy, M87, and its 5,000+ light year-long jet, highly collimated, as imaged by the Hubble Space Telescope. Image credit: NASA and The Hubble Heritage Team (STScI/AURA).
From Denier on black hole jets and their cause: “How is the inability to discern the electric charge of the matter that makes up a black hole reconciled with the jets emanating from the poles of feeding black holes? As I understand the theory, the particles in the jets are accelerated by the magnetic field of the black hole. The magnetic field should vary with the make-up of the black hole, no?”
This is actually a hotly debated topic! There certainly are magnetic fields accelerating charged particles here, and that’s what causes the jets. But are these magnetic fields:
Relics of the magnetic fields that existed in the stellar core/neutron star that existed before a black hole formed, remaining due to a process like flux pinning?
A fundamental property of a charged black hole that’s rotating?
Due to electric currents from outside the black hole’s event horizon, due to the accretion disk or other matter outside it?
Image credit: ESO/WFI (visible); MPIfR/ESO/APEX/A.Weiss et al. (microwave); NASA/CXC/CfA/R.Kraft et al. (X-ray).
Of these three options, number 2 is the least favored explanation, as a galaxy like Centaurus A (above) has only a 55 million solar mass black hole; just 13 times as massive as our own. It’s unlikely that such a large electric charge differential will exist in the black hole; what would segregate billions of Coulombs’ worth of charge, keeping ~10^30 extra charges of one type inside the black hole while expelling that amount outside of it? The numbers seem too great to be explained by that possibility, but we have been surprised before.
The Hubble eXtreme Deep Field (XDF), which revealed approximately 50% more galaxies-per-square-degree than the previous Ultra-Deep Field. Image credit: NASA; ESA; G. Illingworth, D. Magee, and P. Oesch, University of California, Santa Cruz; R. Bouwens, Leiden University; and the HUDF09 Team.
From Naked Bunny with a Whip on the vastness of the Hubble eXtreme Deep Field: “Photos like this make me glad I’m so ill-equipped to fathom the vastness on display. I think it’d be overwhelming if I could even approach it.”
Personally, I can’t wait for the James Webb Space Telescope to push these limits back even farther. Is 170 billion galaxies in the observable Universe the right number? Certainly not; it’s surely too low. But by how much? Is the number more like 300 billion? 1 trillion? 100 trillion? And where is the cutoff for what we consider a galaxy: 1% the mass of our Milky Way? 0.1%? 0.001%?
These are questions that we’ll actually have quantifiable answers to over the next generation. It may bend your mind, but it should bend your mind!
The exoplanet Kepler-452b (R), as compared with Earth (L), a possible candidate for Earth 2.0. Image credit: Image credit: NASA/Ames/JPL-Caltech/T. Pyle.
From eric on the exoplanet problem: “This seems a big step to me. AIUI our atmosphere is a result of the particular evolutionary pathway that life took on Earth. Specifically, we have an oxygen rich atmosphere with few sulfides, carbonates, nitrides, etc. because (we think) the earliest forms of life ate the latter and pumped out oxygen as a waste product. If Gould is right and rewinding the tape of life couldn’t be expected to lead to a similar end-state, then there is very little reason to believe that a different rocky planet in a habitable zone with life would develop atmospheric conditions similar to ours.”
It is a big step, but I don’t think it’s necessarily as big a step as you fear. It’s a question of biochemistry, but a relatively simple one: if you’re living in a methane-rich (carbon), ammonia-rich (nitrogen), and water-rich environment (oxygen), what are the good, possible pathways to construct molecules that allow you to gather, store, and harness energy? It turns out a considerable number of successful pathways result in the production of molecular oxygen as a waste product, and hence would severely enrich the atmosphere.
You don’t need a similar end-state to get some similar generic properties, and an oxygen-rich atmosphere may be one of those properties. We’re not sure, as it’s pretty hard to extrapolate probabilities from an N=1 sample size, but certainly examining habitable-zone exoatmospheres will teach us a lot about what’s out there!
Artist’s depiction of the worlds found by Kepler thus far. Image credit: NASA/W. Stenzel.
From Sinisa Lazarek on an objection to 60 billion habitable-zone super-Earth-or-smaller planets in our galaxy: “If of the 150.000 sampled stars, we found 2.000 exoplanets, of which 40% are rocky… that would mean (to round it).. 1000 rocky planets for 150.000 stars, or in other words.. a little less then 1% of the numbers of stars. How can then we have 60 billion estimated habitable worlds in our galaxy, if our galaxy has 100 billion stars. By math above, we should less then 1 billion rocky worlds.. of which some would be in habitable zone. In other words.. in millions.. but not in billions. One order of magnitude lower.
I’m either missing something important, or there’s a mistake somewhere in numbers.”
Which is a good objection; you should be able to run the math for yourself. But this was answered in spirit very well by Denier: “Kepler is finding exoplanets via the transit method which means the orbital plane of the solar system has to be inline enough for Kepler’s cameras to see the planet cross the face of the star. Your back-of-the-napkin calculations left out the odds of that alignment.”
The odds of a good alignment are significantly higher for very close-in planets, and are actually <1% by time you get out to a star’s habitable zone. So that accounts for more than two orders of magnitude in your back-of-the-napkin calculation, and the fact that our galaxy has more like 400 billion stars than 100 billion and that finding inner planets likely means there are many more, outer planets greatly changes the estimates.
The 21 Kepler planets discovered in the habitable zones of their stars, no larger than twice the Earth’s diameter. Image credit: NASA Ames/N. Batalha and W. Stenzel.
From Denier on tidal locking and what that means for exo-life: “A big concern, and something I didn’t see addressed in the article was tidal locking. Even if you do get a planet the right size, made from the right stuff, and the correct distance from the star to support liquid water on the surface, if it is tidally locked it is not going to be Earth 2.0.”
First off, I should clarify that “Earth 2.0” doesn’t necessarily mean a planet exactly like Earth, but rather one that has complex life on its surface and that also isn’t totally inhospitable to humans. This could, however, look very different than Earth does. Yes, it’s true that most rocky planets the size of Earth or smaller in the habitable zone of an M-dwarf would probably be locked after ~5 billion years, a calculation you can do yourself.
But that doesn’t mean:
You can’t have life thriving in a “ring” on the border between night and day.
You can’t have a strong atmosphere that transports heat and energy evenly around the planet (Venus does, for instance).
Or you can’t have “day side” life that thrives that simply looks different from the life we know.
It might not look like Earth 1.0, but it might still be a great Earth 2.0 candidate.
Image credit: Nicolle Rager Fuller of the NSF.
From Michael Kelsey on supernova nucleosynthesis: “Theoretically, how confident are you that the r-process (i.e. single neutron capture) can really produce trans-plutonian elements? Most of the decay channels for those (man-made) elements are alpha decays, not betas. I couldn’t find (in my cursory search) papers to support your statement; any chance you can point me to a decent review?”
First off, let me be very clear about three facts:
This is an active field of research where theoretical developments are far ahead of observational constraints.
It is also not my primary field of study; I know about it tangentially, not from my own research.
But there are good theoretical reasons why there should be some r-process production, even though the greatest abundance of these trans-uranic (or trans-plutonic, which I think is the right word) elements should be created in neutron-star mergers.
Two neutron stars colliding, which is the primary source of many of the heaviest periodic table elements in the Universe. Image credit: Dana Berry, SkyWorks Digital, Inc.
The expectation is that the supernova neutron flux — which is intense, at ~10^22 neutrons/cm^2/s — should result in neutron capture rates of ~1 neutron-per-minute, give or take. Now, supernovae are fast processes, but neutrons stick around for some time, and there’s going to be a probability distribution function that gives non-zero realizations, in a typical supernova, for the capture of up to ~20-30 neutrons by an initial (let’s say) uranium nucleus. Get up to U-239, U-241 or U-242 and you make neptunium in minutes, which makes plutonium in minutes as well. There is some considerable evidence that primordial Pu-244 exists on Earth.
If you make either Pu-243 or Pu-245 or higher, it beta decays as well, creating Americium, almost all of which — at those masses — will beta decay into curium, which has some isotopes that are quite stable! Cm-247 lives for ~16 million years on average, which isn’t enough that any of it is found on Earth, but perhaps there was some when life first arose on our planet. By looking at half-lives and preferred decay pathways, neutron capture should be able to get you all the way up the actinide chain and even into elements like 104-through-106, although probably not further than that. You asked for some reviews, and I don’t know that this will sate you, but here are a few papers you might consider if you’re interested in further reading:
From rev on some Forbes-and-Ethan bashing: “@Ethan: Still on forbes? I don’t understand. Something is rotten in the state of Science.”
They pay me to write for them. If you’d rather pay me instead, perhaps I’ll write where you choose?
Image credit: E. Siegel, based on work by Wikimedia Commons users Azcolvin 429 and Frédéric MICHEL.
From Claud Owens on the edge of the Universe: “Let us say that we finally reach the outer limit of the universe. What should we call that on the other side of the limit?”
First off, you can’t, not unless you poke a hole in the fabric of spacetime and come out in a special-relativity-violating location. The limits of what we can reach are about 1/3 of the way to the edge of the visible Universe. If you could magically transport yourself — via wormhole or somesuch method — to the outer limit of the observable Universe, you’d simply find more Universe that was like our own on large scales and different in detail on small ones. You’d call it “Universe”, but to someone who couldn’t see it, we might (depending on our definitions) call it part of the multiverse.
Fluctuations in spacetime itself at the quantum scale get stretched across the Universe during inflation, giving rise to imperfections in both density and gravitational waves. Image credit: E. Siegel, with images derived from ESA/Planck and the DoE/NASA/ NSF interagency task force on CMB research.
From Jose Pacheco on the Hot Big Bang: “The Big Bang Theory doesn’t say the universe came from nothing. It says that if we rewind the universe to a point about 13.8 billion years ago, the entirety of the universe was very close together. There is a point though, where current physics break down, and we don’t know what came before.”
A Type Ia supernova in the nearby galaxy M82. This one is fundamentally different from the one atop this page, observed in 2011 in M101. Image credit: NASA/Swift/P. Brown, TAMU.
And finally, from Michael Richmond on the supernova/dark energy conundrum: “Ethan, could you please provide references for statements like “a 2015 study put forth a possibility that many scientists dreaded?” I read the article on Forbes, and I couldn’t find the reference there, either.”
Although EpiPete provided the links in a comment and the “a 2015 study showed another possibility” actually links to the press release from the Forbes article to the U. of A. piece, I thought I’d take the opportunity to discuss what the difference between the supernovae are and why it doesn’t wreck the accelerating Universe. What Peter A. Milne’s study found is that there are actually two classes of type Ia supernovae: some are “bluer” and some are “redder”. The bluer type are the minority nearby, where most of them are red, but are the majority type at great cosmic distances, where fewer are red. Therefore, there’s a bit of a bias to the data. However, as Milne says:
“To be clear, this research does not suggest that there is no acceleration, just that there might be less of it.”
You will notice that earlier dark energy reports had ~72-76% of the Universe’s energy in the form of dark energy, while more recent ones have it at ~66-68%. The Universe is still accelerating, dark energy is still a cosmological constant, and it’s still dominating the energy density of the Universe. There’s just a few percent less of it than we thought!
Have a great week, and thanks for all your support! See you back tomorrow for even more of the Universe!
Discover the cosmos! Each day a different image or photograph of our fascinating universe is featured, along with a brief explanation written by a professional astronomer.
Explanation: Blown by the wind from a massive star, this interstellar apparition has a surprisingly familiar shape. Cataloged as NGC 7635, it is also known simply as The Bubble Nebula. Although it looks delicate, the 7 light-year diameter bubble offers evidence of violent processes at work. Above and left of the Bubble's center is a hot, O-type star, several hundred thousand times more luminous and around 45 times more massive than the Sun. A fierce stellar wind and intense radiation from that star has blasted out the structure of glowing gas against denser material in a surroundingmolecular cloud. The intriguing Bubble Nebula and associated cloud complex lie a mere 7,100 light-years away toward the boastful constellation Cassiopeia. This sharp, tantalizing view of the cosmic bubble is a composite of Hubble Space Telescope image data from 2016, released to celebrate the 26th anniversary of Hubble's launch.
Discover the cosmos! Each day a different image or photograph of our fascinating universe is featured, along with a brief explanation written by a professional astronomer.
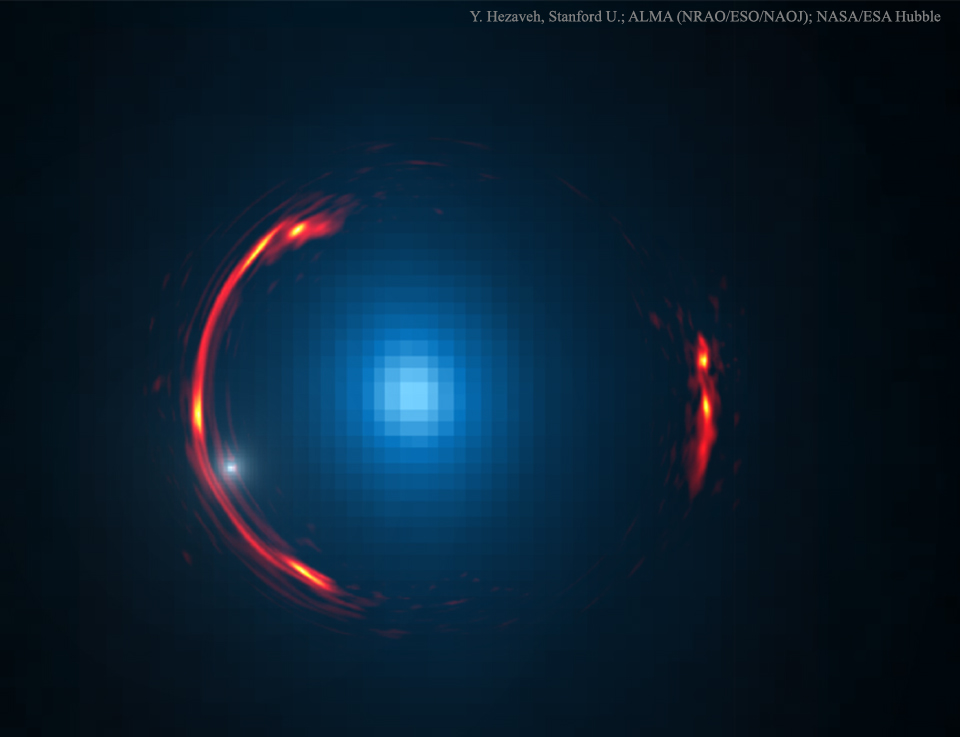
Explanation: Can one galaxy hide behind another? Not in the case of SDP.81. Here the foreground galaxy, shown in blue in an image taken by the Hubble Space Telescope, acts like a huge gravitational lens, pulling light from a background galaxy, shown in red in an image taken in radio waves by the Atacama Large Millimeter Array (ALMA), around it, keeping it visible. The alignment is so precise that the distant galaxy is distorted into part of a ring around the foreground galaxy, a formation known as an Einstein ring. Detailed analysis of the gravitational lens distortions indicate that a small dark satellite galaxy participates in the deflections, bolstering indication that many satellite galaxies are quite dim and dominated by dark matter. That small galaxy is depicted by a small white dot on the left. Although spanning only a few arcseconds, the featured Einstein ring is really tens of thousands of light years across.
Comments, questions? Just click the Discuss link two lines below.
Discover the cosmos! Each day a different image or photograph of our fascinating universe is featured, along with a brief explanation written by a professional astronomer.
2016 April 19
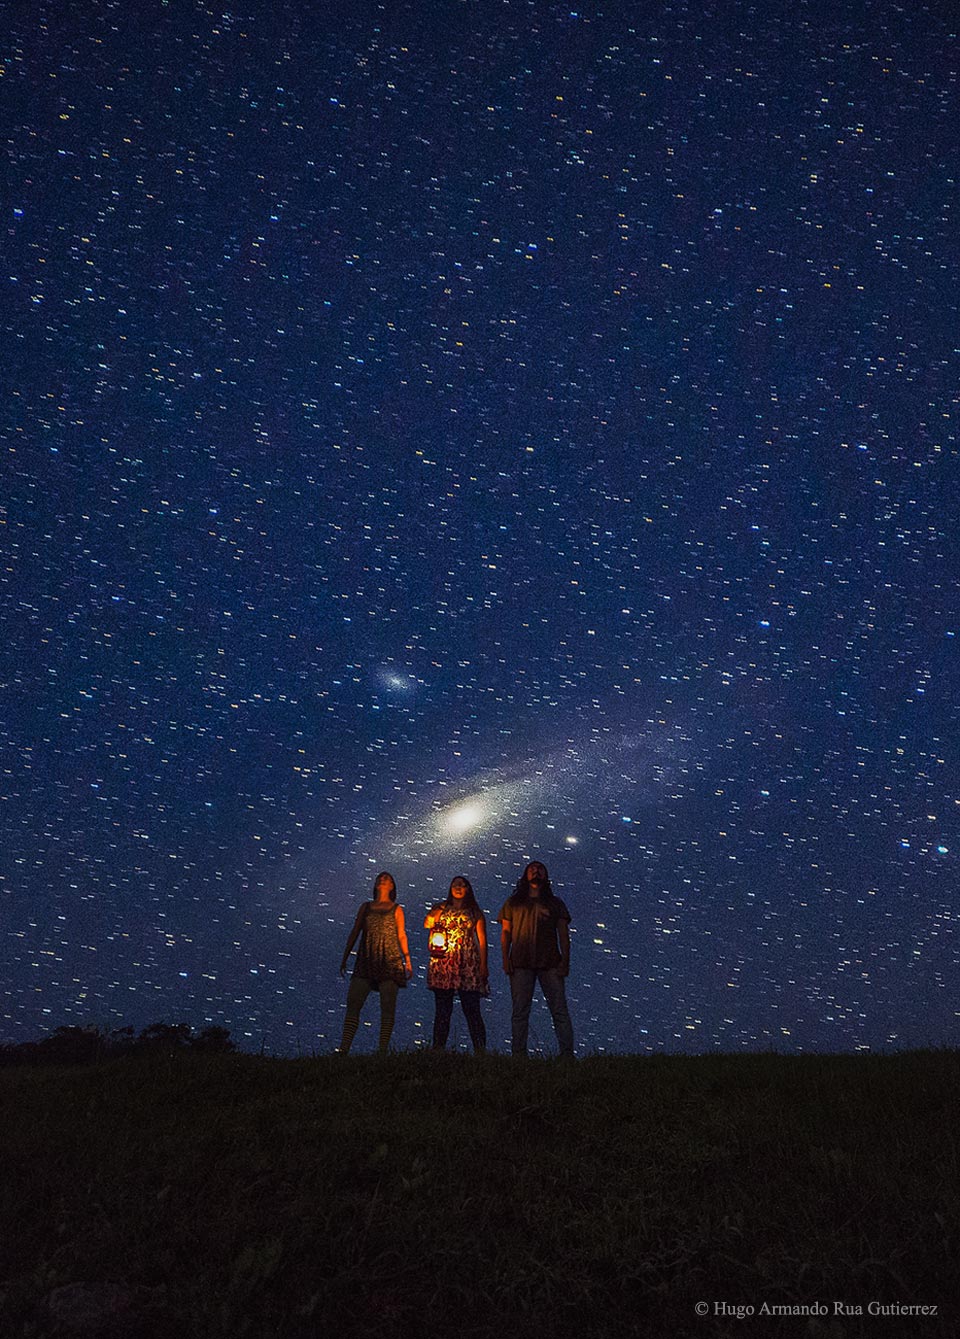
Explanation: What’s that rising over the hill? A galaxy. Never having seen a galaxy themselves, three friends of an industrious astrophotographer experienced an exhilarating night sky firsthand that featured not only the band of our Milky Way galaxy but also Milky Way's neighbor -- the Andromeda galaxy. Capturing the scene required careful pre-shot planning including finding a good site, waiting for good weather, balancing relative angular sizes with a zoom lens, managing ground lighting, and minimizing atmospheric light absorption. The calculated shot therefore placed the friends on a hill about 250 meters away and about 50 meters up. The featured single-exposure image was taken last July 26 at about 11:30 pm in Guatape, Colombia, about two hours from Medellin. The surrounding stars visible are all nearby in our own galaxy, while the small galaxy just above M31 is Andromeda's satellite M110.
Discover the cosmos! Each day a different image or photograph of our fascinating universe is featured, along with a brief explanation written by a professional astronomer.
Explanation: The International Space Station is the largest object ever constructed by humans in space. The station perimeter extends over roughly the area of a football field, although only a small fraction of this is composed of modules habitable by humans. The station is so large that it could not be launched all at once -- it continues to be built piecemeal. To function, the ISS needs huge trusses, some over 15 meters long and with masses over 10,000 kilograms, to keep it rigid and to route electricity and liquid coolants. Pictured above, the immense space station was photographed from the now-retired space shuttle Atlantis after a week-long stay in 2010. Across the image top hangs part of a bright blue Earth, in stark contrast to the darkness of interstellar space across the bottom.
Discover the cosmos! Each day a different image or photograph of our fascinating universe is featured, along with a brief explanation written by a professional astronomer.
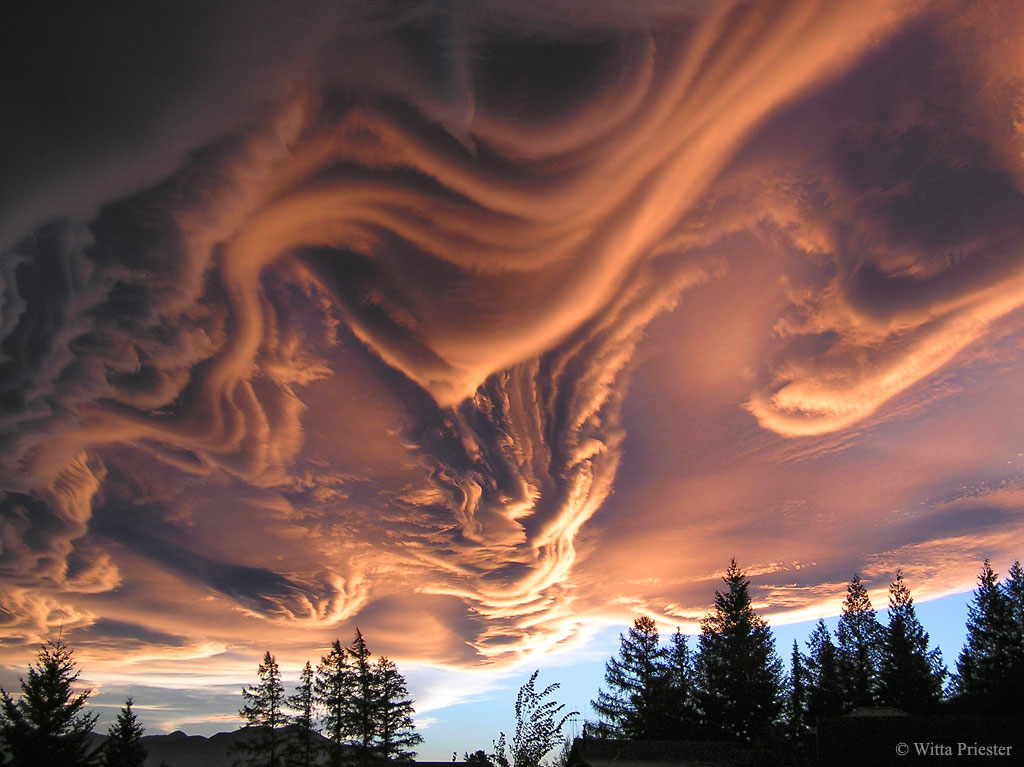
Explanation: What kind of clouds are these? Although their cause is presently unknown, such unusual atmospheric structures, as menacing as they might seem, do not appear to be harbingers of meteorological doom. Known informally as Undulatus asperatus clouds, they can be stunning in appearance, unusual in occurrence, are relatively unstudied, and have even been suggested as a new type of cloud. Whereas most low cloud decks are flat bottomed, asperatus clouds appear to have significant vertical structure underneath. Speculation therefore holds that asperatus clouds might be related to lenticular clouds that form near mountains, or mammatus clouds associated with thunderstorms, or perhaps a foehn wind -- a type of dry downward wind that flows off mountains. Such a wind called the Canterbury arch streams toward the east coast of New Zealand's South Island. The featured image, taken above Hanmer Springs in Canterbury, New Zealand, in 2005, shows great detail partly because sunlight illuminates the undulating clouds from the side.
Discover the cosmos! Each day a different image or photograph of our fascinating universe is featured, along with a brief explanation written by a professional astronomer.
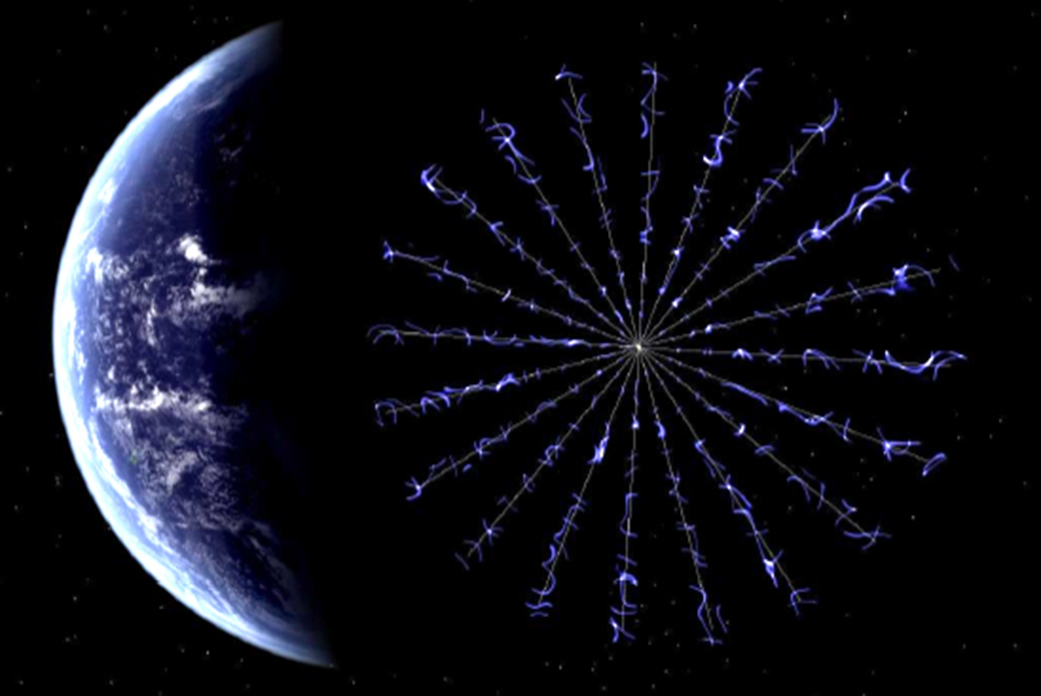
Explanation: Want to take a fast trip to the edge of the Solar System? Consider a ride on a Heliopause Electrostatic Rapid Transit System (HERTS). The concept is currently being tested and it might take only 10 to 15 years to make the trip of over 100 Astronomical Units (15 billion kilometers). That's fast compared to the 35 years it took Voyager 1, presently humanity's most distant spacecraft, to approach the heliopause or outer boundary of the influence of the solar wind. HERTS would use an advanced electric solar sail that works by extending multiple, 20 kilometer or so long, 1 millimeter thin, positively charged wires from a rotating spacecraft. The electrostatic force generated repels fast moving solar wind protons to create thrust. Compared to a reflective solar light sail, another propellantless deep space propulsion system, the electric solar wind sail could continue to accelerate at greater distances from the Sun, still developing thrust as it cruised toward the outer planets.
Discover the cosmos! Each day a different image or photograph of our fascinating universe is featured, along with a brief explanation written by a professional astronomer.
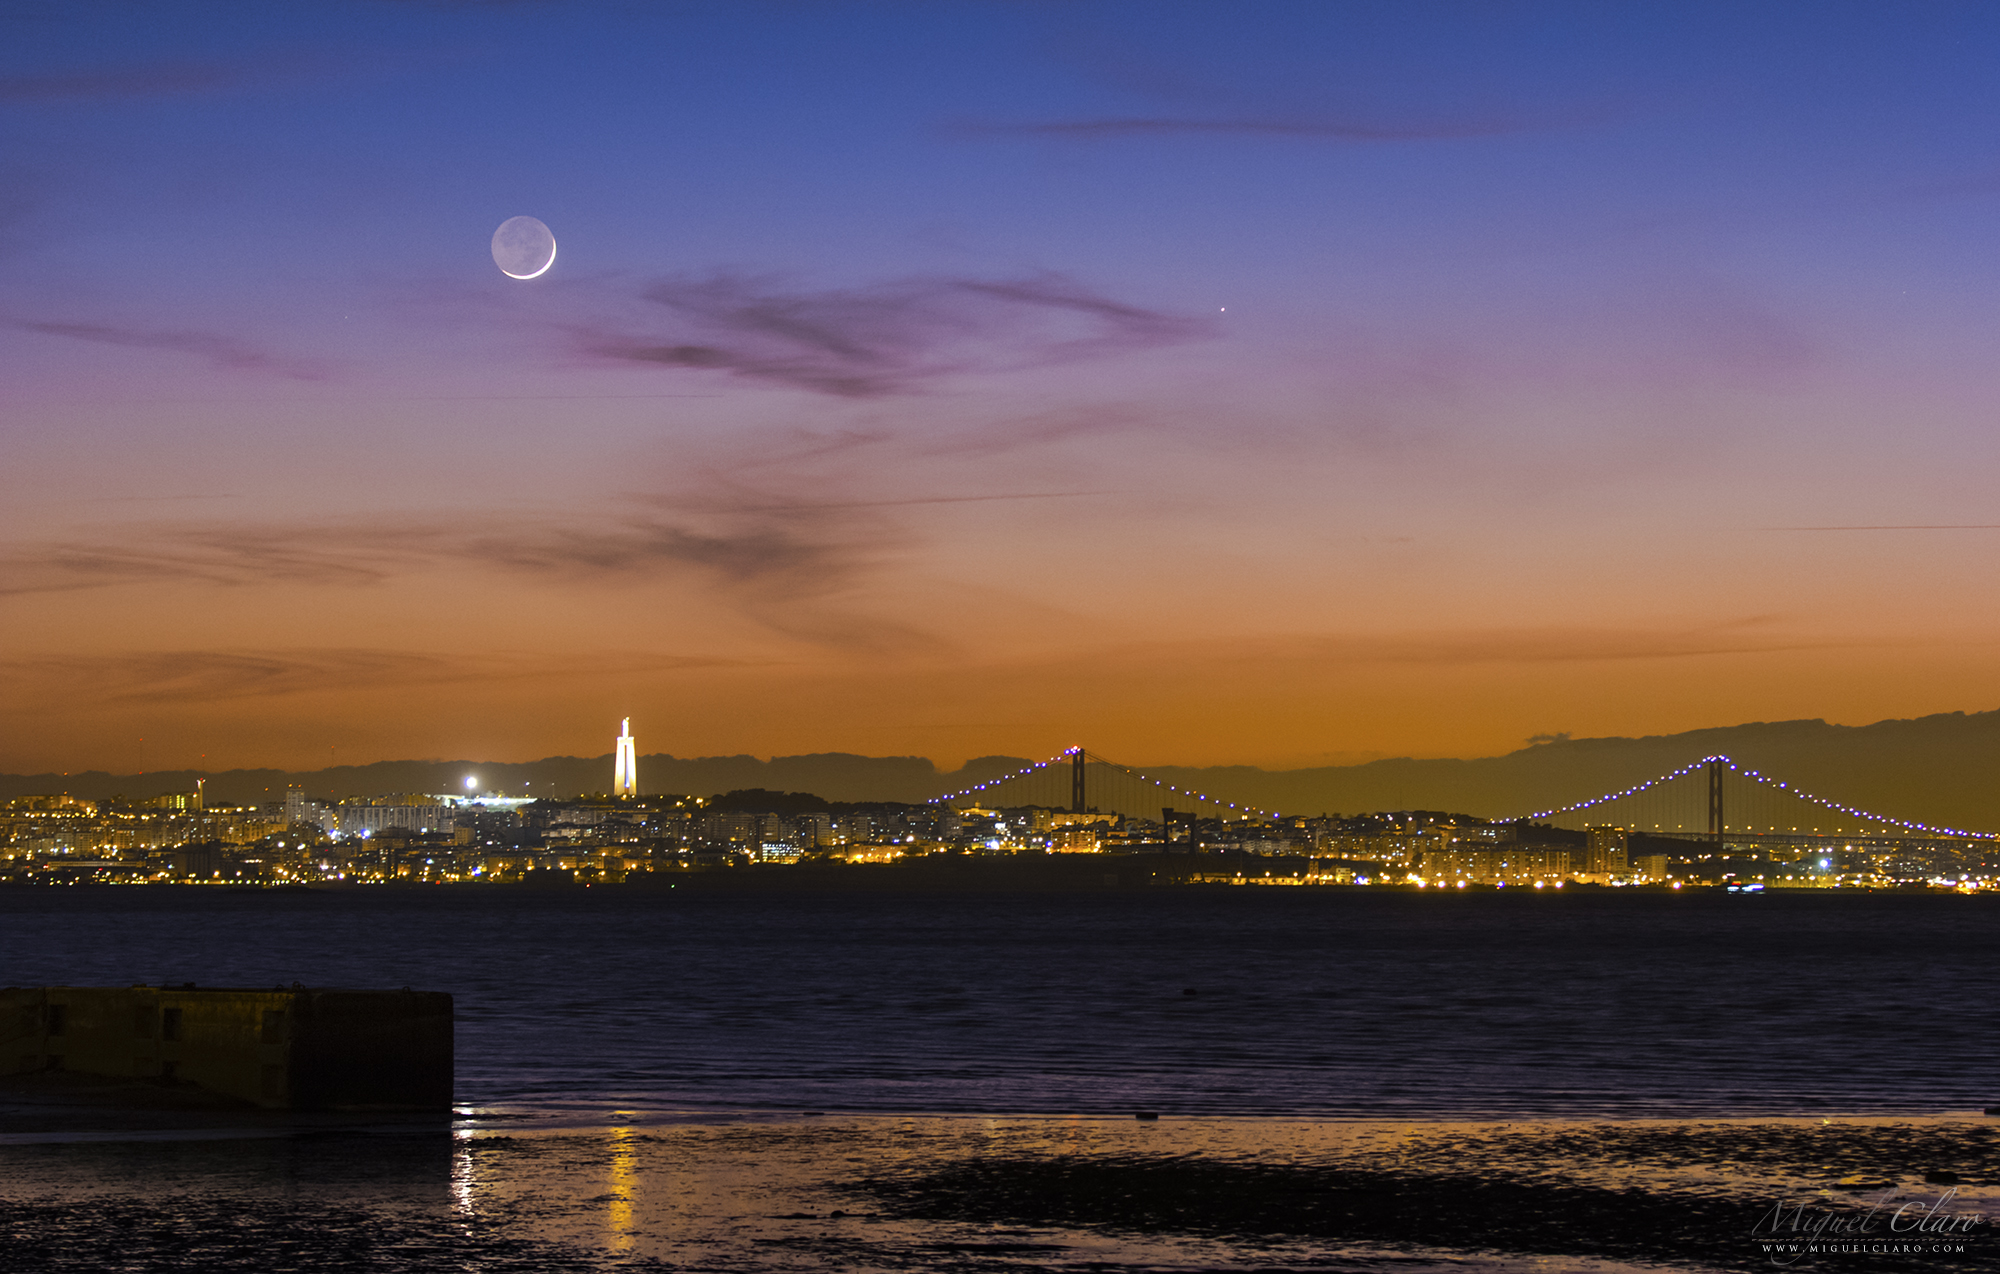
Explanation:Innermost planet Mercury and a thin crescent Moon are never found far from the Sun in planet Earth's skies. Taken near dusk on April 8, this colorful evening skyscape shows them both setting toward the western horizon just after the Sun. The broad Tagus River and city lights of Lisbon, Portugal run through the foreground under the serene twilight sky. Near perigee or closest approach to Earth, the Moon's bright, slender crescent represents about 3 percent of the lunar disk in sunlight. Of course as seen from the Moon, a nearly full Earth would light up the lunar night, and that strong perigee earthshine makes the rest of the lunar disk visible in this scene. Bright Mercury stays well above the western horizon at sunset for northern skywatchers in the coming days. The fleeting planet reaches maximum elongation, or angular distance from the Sun, on April 18. But Mercury will swing back toward the Sun and actually cross the solar disk on May 9, the first transit of Mercury since November 8, 2006.
Hubble Spies a Spiral Snowflake: Hubble Spies a Spiral Snowflake: Together with irregular galaxies, spiral galaxies make up approximately 60 percent of the galaxies in the local universe. However, despite their prevalence, each spiral galaxy is unique — like snowflakes, no two are alike. This is demonstrated by the striking face-on spiral galaxy NGC 6814.


